Matic USDTMATIC Setup. After a confirmed breakout from the marked zone in green, we could take an entry at 0.7924. Remember stop loss is your friend. Everything is on the chart.
Entry 0.7924
S.L 0.7092
T.P 1 0.8598
T.P 2 0.9483
T.P 3 1.0664
T.P 4 1.1854
MATICUSDT.3S trade ideas

#MATIC Spot Opportunity#MATIC Spot Opportunity
Breakout of main resistance trendline.
Waiting for Ascending Triangle breakout.
Will DCA from now

⚡️🌩️ "Matic Coin Analysis: Navigating the Storm "💀💰🕵️♂️ Let's delve into the analysis of the Matic coin for future trades, considering the likelihood of ranging and discomfort in trading for this week.
🕰️ In the weekly timeframe, after hitting the box ceiling and resistance at 1.2745, red candles emerged, indicating the presence of sellers in the market, leading to a 50% price drop. This event has occurred for most coins.
📊 In general, after the market correction and drop, coins can be divided into two categories for position-taking. The first category includes coins that either did not experience heavy drops or quickly recovered after a drop, regaining most of their losses. The second category includes coins that, after the drop, started ranging and oscillating in smaller boxes. The coin we are analyzing today belongs to the second category.
💹 In the four-hour timeframe, after losing support at 0.8677, we moved towards support at 0.6465, and we are currently oscillating between 0.6465 and 0.7470.
💰 For a long position, we can enter early and riskily, mainly because we could be in the accumulation range and initiate an upward trend after breaking the resistance. We will open our long position with low risk after 0.7470 and quickly secure profits and close our position.
🌟 For a short position, we are currently following the trend. We can open a short position in two scenarios:
📉 The first scenario is if we reach the line at 0.6920 and show a reaction. If this line breaks, we can open positions on lower timeframes. If 0.6465 is sharply broken without a position, we can consider entering a position, but if we show a reaction and support at 0.6465, there is a chance of a stop-loss.
🎯 The second scenario is to wait for the formation of the bottom box line at 0.6465. If this line breaks, accompanied by volume, we can logically open our short position and follow the trend.
🔍 Additionally, we have an educational point about how to identify a Fake Breakout, as indicated on the chart. If we go to higher timeframes and see shadows instead of candle shadows, as is the case in the daily timeframe, we consider this a fake breakout in the lower timeframe.
🛡️ The upcoming support levels are 0.6465, 0.5714, and 0.5018, while the resistance levels are 0.8677, 0.9515, and 1.1137 on this chart.
🛒 For buying Matic, be patient for now. If we have an entry point, I will definitely share it within this channel for you.
😊 If you'd like me to analyze a specific coin or currency pair, be sure to comment so that I can allocate the next analysis for you!
⚠️ Also, please remember that I'm just an analyst, and this isn't financial advice. We're here to stay in the market and maximize profits by adhering to risk and capital management principles.

📈MATIC Analysis: Waiting for Box Breakout in 4-Hour Timeframe🚀🔍Today's market saw a notable rebound from a crucial support level, reaffirming the buying opportunity for investors keen on sustaining prices above this support. As emphasized in previous analyses, the breach of this support and subsequent consolidation below it would likely signal a bearish trend, making position opening challenging until proximity to this support.
⚡️Currently, Bitcoin has undergone a minor upward correction, with altcoins also nearing the upper bounds of their respective boxes. The coin under scrutiny today is Matic (MATIC), with analysis focused on the 4-hour timeframe. Matic is currently confined within a box ranging from 0.6449 to 0.7491.
🔔Utilizing the volume fixed range profile indicator reveals balanced volumes within the box, suggesting a prudent approach of waiting for a breakout before considering positions. Therefore, the entry point for a long position is at 0.7491, while for a short position, it's at 0.6449.
📈For long positions, consider targeting the area around 0.8685, a strong supply zone where price rejection may occur. Conversely, for short positions, 0.5057 serves as a suitable target, offering robust support and aligning with the 1 Fibonacci extension.
✅However, the optimal exit strategy entails waiting for a trend reversal before exiting the position. This advanced approach necessitates a deep understanding of market dynamics and significant trading experience.
📊Additionally, dwindling volumes indicate waning trader interest within this range. When traders, especially those with significant trading volumes, are disinterested, it's prudent for others to refrain from trading.
💎For RSI confirmation, breaking above 64.27 could serve as a signal for long positions. However, given the market's lack of momentum, reliance solely on momentum indicators like RSI may not be advisable.
📝In conclusion, exercising patience for a breakout from the current box range is prudent for Matic traders, with strategic entry and exit points crucial for successful trading amid prevailing market conditions.

⚡️MATIC: Disney's Crypto Of ChoiceMatic Polygon, formerly known as the Matic Network, is a Layer 2 scaling solution for the Ethereum blockchain. It was rebranded in 2021 to Polygon Technology to reflect its expanded scope and mission. The platform aims to improve the scalability and usability of Ethereum by providing a framework for building and connecting Ethereum-compatible blockchain networks. The native token of the Polygon network is MATIC, which is used for various purposes within the ecosystem, such as transaction fees and staking. Polygon offers a solution to the challenges faced by the Ethereum network, including slow transaction processing BINANCE:MATICUSDT times and high transaction fees, by enabling faster and cheaper transactions.

MATICUSDT IDEAHello Traders Hope You Are Enjoying Our Analysis. Today We Will Discuss About MATIC
(Update)
The Descending Channel Has Confirmed Breakout In 12H Timeframe⚡️
Expecting Massive Bullish In Coming Days Just Hold With Patience

MATICUSDTMATICUSDT
I think it is wrong to write a currency in a view for ascending or descending
The matic currency is likely to follow this road map, so this is a personal opinion and analysis, you can enter with your own strategy and opinion.

MATICUSDT IDEAHey traders hope you are enjoying our analysis. Now we are here again with a new trading opportunity. We will discuss today about MATIC
MaTIC Descending Triangle Breakout Already Confirmed in 4H Timeframe✍️
Expecting 30%Bullish Wave In Coming Days📈

MATIC/USDThello everyone!
sell entry at 72 and SL at 73.........trail your stoploss with profit.........
good luck

shark pattern+ cluster fibo + trriger +setup+trend up+RSI shark pattern+ cluster fibo + trriger +setup+trend up + DOUBLE BOTTOM

Do you have cash? Then you should buy this. "MATICUSDT"Hello, guys.
This is ESS team.
Let's see the MATICUSDT chart.
It's reached the uptrend line, which is up a whopping 3000% move.
If it is supported by the orange uptrend line, It is going to reach the GREEN downtrend line.
If it breaks through to the RED long-term downtrend line...
may be....3000% ..?

MATICUSD 1WMATIC ~ 1W
#MATIC The movement of CRYPTOCAP:MATIC is increasingly limited in this pattern. It looks like Whales still maintain Support in this pattern.
We are still long-term bullish on #MaticUSD as long as price still maintains this support.

MATICUSDT IDEAHello Trading view Family / Fellow Traders.
I hope you have used and benifited from the previous analysis .
In today trading session we are monitoring MATICUSDT for a buying opportunity,
MATICUSDT UPDATE
Descending triangle Breakout Has Already Confirmed ,Incase of successful breakout Expecting Bullish Rally Towards 1.0000💰 In Coming Days ✍️ ✅

MATICUSDTmy entry on this trade idea is taken from a point of interest ABOVE an inducement.. I extended my stoploss area to cover for the whole swing as price can target the liquidity there before going as i anticipate.. just a trade idea, not financial advise

Polygon(MATIC): Re-Test Looking Good / Short SetupPolygon Coin has made a decent breakdown of the local support zone, and the price is now having a re-test of that same broken zone.
We are now looking for full rejection near that zone and further downward movement beyond that target zone!
Swallow Team

Time to MATIC ;)Matic is that one coin which has not pumped as expected.
But during the bull run ,
Matic is going to BOOOOMMM
Last chance to buy it in this range, and it will boom in next 6 months as BTC stabilizess
Enjoy ;)

✴️ Polygon | No New Highs In 66 Days, Why? What Is Happening?➖ Notice that Polygon (MATICUSDT) has been moving within a lower high for more than two months, 66 days.
➖ Notice that it has been moving within a wide range for 109 days, more than three months.
More than three months and basically no growth, why?
How can we interpret this information?
What does this means for Bitcoin and the Cryptocurrency market as a whole?
Polygon is part of the big Altcoins. TOP 20. Big market capitalization; it moves with Bitcoin.
When the market moves from a bearish to bullish phase, the first projects to move are the big ones.
When the big ones stop moving, the smaller ones start to grow.
Notice how MATICUSDT produces no growth in 66 days, literally, while at the same time you can find now hundreds of Altcoins growing by 100%, 200%, 300% and even more within days or weeks. Many are now at 500%, 600% and more growth in a period of several months.
So even if Bitcoin, Cardano, Ethereum, Solana, etc., were continue higher they would only grow 10%, 20% and even 50% if you are extremely lucky. While the smaller Altcoins have room to grow 300%, 500% and even 700% in just a normal scenario. Some can grow many times more.
👉 What is happening is that money is flowing from Bitcoin and the big Altcoins toward the smaller ones. This is how it normally goes, this is how it works.
👉 Bitcoin's bullish wave is over and that's why the rest of the market is now going on bull-run more... This is great.
This is a tremendous opportunity for those who trade.
You can enjoy big profits, create a capital and safe for massive growth in 2025 and 2024.
Sell high and at the top to later buy again, buy more when prices are low and near support.
Namaste.

MATICUSDT in continuous patternMATICUSDT is forming a rising wegde of continuous pattern and trade has been place according to it.

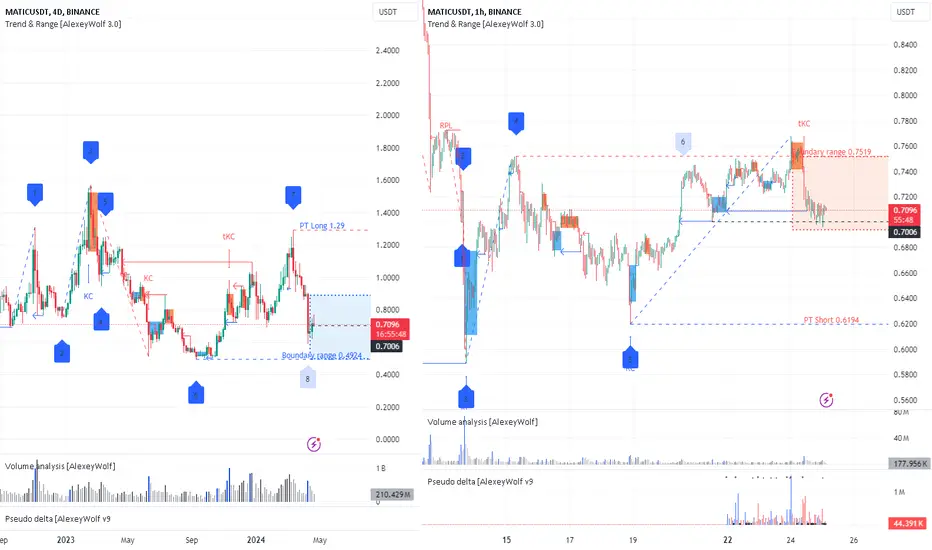
MATICUSDT. Trading opportunityA sideways range has formed on 4D TF. The seller's vector has reached the obligatory goal. The buyer has not yet shown strength. I will wait for buyer action to buy. The target could be 1.29.
A sideways range has formed on the hourly timeframe. Buyer vector 5-6 has been won back. The seller vector (6-7) is currently relevant.
If the seller breaks the 0.7006 level and defends it, then I believe the price could reach 0.6194. I think 0.6194 is a good price to buy.
Matic Bottom & TOP follow this Line's prentMatic Bottom & TOP follow this Line's prent
bottom from now 0.50
top from now 5.50 to 6usdt
hahahahaha
thnx me later

MATIC: RARE Pattern ! Three Drive spotted 📉📉 MATIC - USDT 📈
The three-drive is a rare price pattern formed by three consecutive symmetrical moves (or drives) up or down. In its bullish form, the market is making three final drives to a bottom before an uptrend forms. In a bearish three-drive, it is peaking before the bears take over. this means that we SHOULD bottom soon, at least. And the next landing zone could be a good accumulation point.
At first glance, it may appear bullish - since the price is now consolidating under a "resistance zone", which is normally a bullish indicator when the price is INCREASING, but not when the price is decreasing.
This is infact not consolidation under a resistance zone, but should be seen instead as another failed bounce on a key support zone.
The immediate price we can expect to see in the short term is 0.59c, however this zone was already tested with a wick - meaning it will be weaker when we head there for a second test.
Although it's a great alt to have as a part of your diversified portfolio; I've been bearish on Matic for a while, with my previous update also cautioning sell for short term:
_______________________
📢Follow us here on TradingView for daily updates📢
👍Hit like & Follow 👍
CryptoCheck
BINANCE:MATICUSDT

MATIC/USDT WEEKLYHello everyone!
Matic is moving in a sym. triangle pattern .Actually it is a liquidity pattern. Market will take the liquidity of the lower trend line then there will be a strong movement upward to grab all the liquidity above. Three future targets are mentioned .Buy area is 0.48-0.56
1.27
1.55
1.77
Good Luck

maticTwo ranges for mid-term and long-term buying are specified in the chart, and the price will show a bullish reaction when it reaches those two areas.
