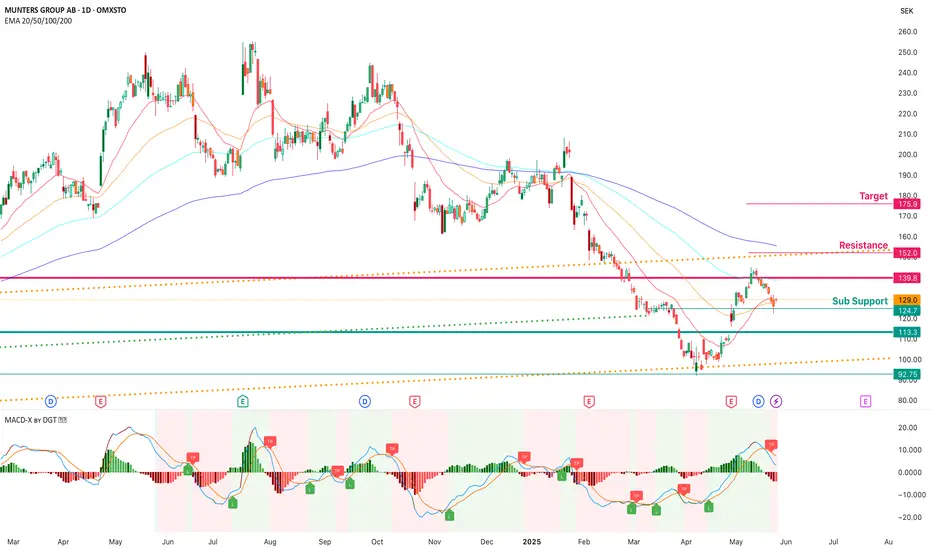
Munters – Reversal Signal in the Main Channel📈 Current Status
The stock is currently trading at 129.0 SEK.
After pulling back to the lower boundary of the long-term upward channel, the price is showing signs of recovery.
It has recently rejected resistance around 139–140 SEK and is seeking momentum to break through.
🔍 Technical Indicators
Munters Group AP
No trades
Next report date
—
Report period
—
EPS estimate
—
Revenue estimate
—
0.08 USD
11.47 M USD
1.59 B USD
180.33 M
About Munters Group AB
Sector
Industry
CEO
Klas Forsström
Website
Headquarters
Stockholm
Founded
2010
IPO date
May 19, 2017
Identifiers
2
ISIN SE0009806607
Munters Group AB engages in the business of supplying energy efficient dehumidification and air treatment solutions. It operates through the following segments: AirTech, Data Center Technologies, FoodTech, and Other. The AirTech segment includes manufacturing and marketing products and holistic solutions for controlling humidity and improving the indoor climate. The Data Center Technologies segment focuses on supplying advanced climate cooling solutions using a wide range of heat rejection technologies. The FoodTech segment is involved in energy-efficient products and systems to create the right indoor climate for the animal husbandry and horticultural industries. The company was founded by Carl Munters in 1955 and is headquartered in Stockholm, Sweden.
Related stocks
Long MTRS DailySimple naked priceaction.
Long from support area, my suggestion is to go for 3R in strong trend. Only 25% winrate to break even.

Swing trade for MuntersStabile company Munters with positive earnings. Going for a trade after break out over 66 if we get a buy signal. Target idea of close to channel roof.
Not necessarily a parabolic rise.

See all ideas
Summarizing what the indicators are suggesting.
Neutral
SellBuy
Strong sellStrong buy
Strong sellSellNeutralBuyStrong buy
Neutral
SellBuy
Strong sellStrong buy
Strong sellSellNeutralBuyStrong buy
Neutral
SellBuy
Strong sellStrong buy
Strong sellSellNeutralBuyStrong buy
An aggregate view of professional's ratings.
Neutral
SellBuy
Strong sellStrong buy
Strong sellSellNeutralBuyStrong buy
Neutral
SellBuy
Strong sellStrong buy
Strong sellSellNeutralBuyStrong buy
Neutral
SellBuy
Strong sellStrong buy
Strong sellSellNeutralBuyStrong buy
Displays a symbol's price movements over previous years to identify recurring trends.
Frequently Asked Questions
The current price of MMNNF is 20.43 USD — it has decreased by −5.00% in the past 24 hours. Watch Munters Group AP stock price performance more closely on the chart.
Depending on the exchange, the stock ticker may vary. For instance, on OTC exchange Munters Group AP stocks are traded under the ticker MMNNF.
MMNNF stock has risen by 7.50% compared to the previous week, the month change is a 8.76% rise, over the last year Munters Group AP has showed a 33.93% increase.
We've gathered analysts' opinions on Munters Group AP future price: according to them, MMNNF price has a max estimate of 26.60 USD and a min estimate of 19.81 USD. Watch MMNNF chart and read a more detailed Munters Group AP stock forecast: see what analysts think of Munters Group AP and suggest that you do with its stocks.
MMNNF reached its all-time high on Jul 23, 2024 with the price of 24.50 USD, and its all-time low was 2.43 USD and was reached on Mar 20, 2020. View more price dynamics on MMNNF chart.
See other stocks reaching their highest and lowest prices.
See other stocks reaching their highest and lowest prices.
MMNNF stock is 6.54% volatile and has beta coefficient of 1.46. Track Munters Group AP stock price on the chart and check out the list of the most volatile stocks — is Munters Group AP there?
Today Munters Group AP has the market capitalization of 3.92 B, it has increased by 8.01% over the last week.
Yes, you can track Munters Group AP financials in yearly and quarterly reports right on TradingView.
Munters Group AP is going to release the next earnings report on Apr 28, 2026. Keep track of upcoming events with our Earnings Calendar.
MMNNF earnings for the last quarter are −0.01 USD per share, whereas the estimation was 0.14 USD resulting in a −104.66% surprise. The estimated earnings for the next quarter are 0.10 USD per share. See more details about Munters Group AP earnings.
Munters Group AP revenue for the last quarter amounts to 388.87 M USD, despite the estimated figure of 421.96 M USD. In the next quarter, revenue is expected to reach 412.71 M USD.
MMNNF net income for the last quarter is −865.60 K USD, while the quarter before that showed 20.33 M USD of net income which accounts for −104.26% change. Track more Munters Group AP financial stats to get the full picture.
As of Feb 14, 2026, the company has 4.99 K employees. See our rating of the largest employees — is Munters Group AP on this list?
EBITDA measures a company's operating performance, its growth signifies an improvement in the efficiency of a company. Munters Group AP EBITDA is 231.01 M USD, and current EBITDA margin is 13.87%. See more stats in Munters Group AP financial statements.
Like other stocks, MMNNF shares are traded on stock exchanges, e.g. Nasdaq, Nyse, Euronext, and the easiest way to buy them is through an online stock broker. To do this, you need to open an account and follow a broker's procedures, then start trading. You can trade Munters Group AP stock right from TradingView charts — choose your broker and connect to your account.
Investing in stocks requires a comprehensive research: you should carefully study all the available data, e.g. company's financials, related news, and its technical analysis. So Munters Group AP technincal analysis shows the buy rating today, and its 1 week rating is buy. Since market conditions are prone to changes, it's worth looking a bit further into the future — according to the 1 month rating Munters Group AP stock shows the buy signal. See more of Munters Group AP technicals for a more comprehensive analysis.
If you're still not sure, try looking for inspiration in our curated watchlists.
If you're still not sure, try looking for inspiration in our curated watchlists.