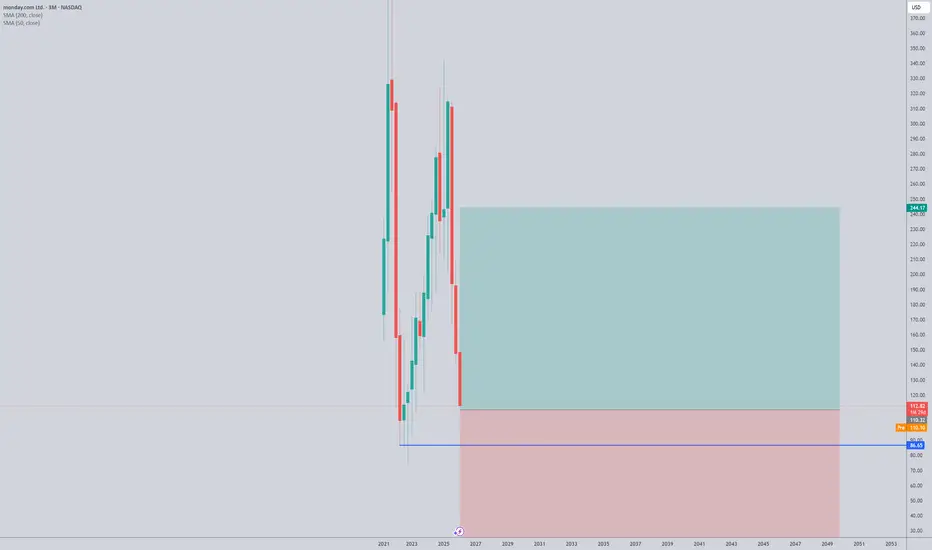
Monday.com MNDY Monday.com is a "Predator" in sheep's clothing. It has a Gross Margin of 89% and 0 debt, making it a financial fortress. The collapse to $114 was due to panic before the report. If the report on February 9 shows that AI is actually helping sales, the stock could be back to $150 in days.
monday.com Ltd.
No trades
Next report date
—
Report period
—
EPS estimate
—
Revenue estimate
—
2.30 USD
118.74 M USD
1.23 B USD
41.10 M
About monday.com Ltd.
Sector
Industry
Website
Headquarters
Tel Aviv
Founded
2012
IPO date
Jun 10, 2021
Identifiers
2
ISIN IL0011762130
monday.com Ltd. engages in the business of operating a cloud-based visual work operating system that consists of modular building blocks that can be easily used and assembled to create software applications and work management tools and serves as a connective layer to integrate with various digital tools across an organization. It operates through the following geographical segments: United States, EMEA, United Kingdom, and Rest of the World. The company was founded by Roy Mann, Eran Kampf, and Eran Zinman in 2012 and is headquartered in Tel Aviv, Israel.
Related stocks
Monday BluesTech is overvalued across the board, especially names like Monday trading at PE ratio of 535 and Forward PE of 67. Revenue growth has been high but signs of deceleration ahead. If the stock market drops heading into the New Year 2025, I think this will be one of the first to fall.
Technically we a

Downtrend in Monday.com?Monday.com has struggled since the summer, and some traders may think its downtrend will continue.
The first pattern on today’s chart is November 10’s sharp decline after guidance lagged estimates. MNDY rebounded briefly after the drop but made a lower high below the bearish gap.
Second is the $14

Monday BluesIf you followed my trade idea on this stock, you would know I was short prior to earnings. The stock tanked 28% today, down almost 50% from recent highs. My short trade is now closed, we are being held up by the POC and golden ratio support zone.
I like the company as a long term hold, it might not

MNDY Earnings Play — Strong Bullish Momentum Ahead of AMC**🚀 MNDY Earnings Play — Strong Bullish Momentum Ahead of AMC**
Monday.com (MNDY) shows powerful fundamentals with 30% revenue growth and a perfect 8-quarter earnings beat streak. Options flow and technicals align for a potential explosive move post-earnings on **2025-08-08 (After Market Close)**.

Overbought levels, could hit 295 before correctionWith top oscillators beyond the OB level, the trend looks to be going in daily, and a hangman is bullish, but it sits on the cusp of a DT. Fireworks!

Monday.com May Start MovingMonday.com has drifted for the last year, but some traders may think the business-software company is ready to start moving.
The first pattern on today’s chart is the bullish price gap on February 10 after earnings, revenue and guidance beat estimates. The shares touched their highest level since l

$MNDY - MONDAYNASDAQ:MNDY - Breakout
After an initial increase of 45%, the price action consolidated with higher lows and reduced volatility (VCP).
Entry 284
Stop loss 273
TP1 30-50%: after 4-5 days
Then Stop follow up (visual) with EMA 10 or EMA 20
Let's see on Monday the price action :)

My Watchlist: MNDYMNDY, an IBD50 stock has a setup signal (1). I'm looking to enter long near the close of the day if the stock can manage to CLOSE above the last candle highs(2). If triggered, I will then place a stop-loss below (3) and a price target above it (4).

MNDY Bull FlagNASDAQ:MNDY has consolidated for 4 days post-earnings. Three bearish candles were observed, followed by a bullish candle closing above the previous two days. This is a bullish signal. The key level of $261 has been surpassed - this is the level of the Volume Point of Control (VPOC) across the three

See all ideas
Summarizing what the indicators are suggesting.
Neutral
SellBuy
Strong sellStrong buy
Strong sellSellNeutralBuyStrong buy
Neutral
SellBuy
Strong sellStrong buy
Strong sellSellNeutralBuyStrong buy
Neutral
SellBuy
Strong sellStrong buy
Strong sellSellNeutralBuyStrong buy
An aggregate view of professional's ratings.
Neutral
SellBuy
Strong sellStrong buy
Strong sellSellNeutralBuyStrong buy
Neutral
SellBuy
Strong sellStrong buy
Strong sellSellNeutralBuyStrong buy
Neutral
SellBuy
Strong sellStrong buy
Strong sellSellNeutralBuyStrong buy
Displays a symbol's price movements over previous years to identify recurring trends.
WLDU
Amundi MSCI World Swap II UCITS ETF Act -Monthly Hedged to USD - Dist-Weight
0.04%
Market value
4.14 M
USD
WLDH
Amundi MSCI World Swap II UCITS ETF Act -Monthly Hedged to EUR - Dist-Weight
0.04%
Market value
4.14 M
USD
Explore more ETFs
Frequently Asked Questions
The current price of MNDY is 73.63 USD — it has decreased by −1.38% in the past 24 hours. Watch monday.com Ltd. stock price performance more closely on the chart.
Depending on the exchange, the stock ticker may vary. For instance, on NASDAQ exchange monday.com Ltd. stocks are traded under the ticker MNDY.
MNDY stock has fallen by −25.77% compared to the previous week, the month change is a −50.23% fall, over the last year monday.com Ltd. has showed a −76.88% decrease.
We've gathered analysts' opinions on monday.com Ltd. future price: according to them, MNDY price has a max estimate of 310.00 USD and a min estimate of 80.00 USD. Watch MNDY chart and read a more detailed monday.com Ltd. stock forecast: see what analysts think of monday.com Ltd. and suggest that you do with its stocks.
MNDY reached its all-time high on Nov 9, 2021 with the price of 450.00 USD, and its all-time low was 73.58 USD and was reached on Nov 9, 2022. View more price dynamics on MNDY chart.
See other stocks reaching their highest and lowest prices.
See other stocks reaching their highest and lowest prices.
MNDY stock is 10.18% volatile and has beta coefficient of 1.73. Track monday.com Ltd. stock price on the chart and check out the list of the most volatile stocks — is monday.com Ltd. there?
Today monday.com Ltd. has the market capitalization of 3.71 B, it has decreased by −23.68% over the last week.
Yes, you can track monday.com Ltd. financials in yearly and quarterly reports right on TradingView.
monday.com Ltd. is going to release the next earnings report on May 18, 2026. Keep track of upcoming events with our Earnings Calendar.
MNDY earnings for the last quarter are 1.04 USD per share, whereas the estimation was 0.92 USD resulting in a 13.23% surprise. The estimated earnings for the next quarter are 0.96 USD per share. See more details about monday.com Ltd. earnings.
monday.com Ltd. revenue for the last quarter amounts to 333.88 M USD, despite the estimated figure of 329.67 M USD. In the next quarter, revenue is expected to reach 340.01 M USD.
MNDY net income for the last quarter is 76.69 M USD, while the quarter before that showed 13.05 M USD of net income which accounts for 487.59% change. Track more monday.com Ltd. financial stats to get the full picture.
No, MNDY doesn't pay any dividends to its shareholders. But don't worry, we've prepared a list of high-dividend stocks for you.
EBITDA measures a company's operating performance, its growth signifies an improvement in the efficiency of a company. monday.com Ltd. EBITDA is 12.12 M USD, and current EBITDA margin is 0.98%. See more stats in monday.com Ltd. financial statements.
Like other stocks, MNDY shares are traded on stock exchanges, e.g. Nasdaq, Nyse, Euronext, and the easiest way to buy them is through an online stock broker. To do this, you need to open an account and follow a broker's procedures, then start trading. You can trade monday.com Ltd. stock right from TradingView charts — choose your broker and connect to your account.
Investing in stocks requires a comprehensive research: you should carefully study all the available data, e.g. company's financials, related news, and its technical analysis. So monday.com Ltd. technincal analysis shows the sell today, and its 1 week rating is strong sell. Since market conditions are prone to changes, it's worth looking a bit further into the future — according to the 1 month rating monday.com Ltd. stock shows the sell signal. See more of monday.com Ltd. technicals for a more comprehensive analysis.
If you're still not sure, try looking for inspiration in our curated watchlists.
If you're still not sure, try looking for inspiration in our curated watchlists.