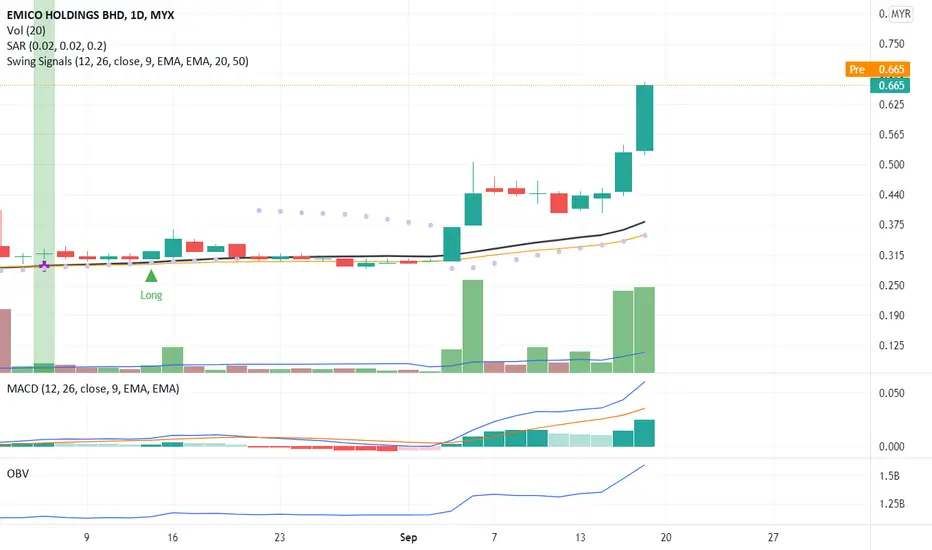
EMICO Time Frame Daily
EMICO TIme Frame Daily
Hai Traders
Interesting to note
Only suitable for long term
Need to close above RBS first before making a decision
Need waiting more confirmation break this accumulation
#thisonlyforpredectionstudy
#thisnotforbuycallorbuysell
#chartpattern
#TAYOR
#MFM.TRADER
0.025MYR
2.85 MMYR
61.02 MMYR
About EMICO HOLDINGS BHD
Sector
Industry
Headquarters
Bayan Lepas
Website
Founded
1973
ISIN
MYL9091OO009
FIGI
BBG000BF6RD3
Emico Holdings Bhd. engages in the manufacture and sale of trophy, souvenir, and medal products. It operates through the following segments: Consumable Products, Property Development, and Investment Holding. The Consumable Products segment focuses on manufacturing and trading of consumable products. The Property Development segment involves in the development of land into residential and commercial buildings. The company was founded by Beng Huan Lim and Lay Choo Loh in 1973 and is headquartered in Bayan Lepas, Malaysia.

EMICO's Wyckoff's analysis with Elliot Wave + VSA. 7/11/21EMICO probably forming an expanding wave flat pattern abc (green)..Price probably now in wave 4 (Red Circled) .. sub way of wave c (green). Price might reach at around 1.095 before completing it uptrend...

EMICO 13-10-2021TP = Take profit
EP = Entry Price
Cut loss when breakout Support level
Smartmoney in accumulation , ready to spike
Early EP triggered


LONG potential EMICOPotential Long if support holds. Moving on new, if more news published will act as a catalyst to push it with the trend direction

short term momentum playStill got something. momentum is still there.can ride for short term play.
if maintain above 0.4-0.44 ,
can see people buying and push it high 0.58

EMICOEntry Point support 0.505
Profit Target min 0.76
Stop Loss 0.4
#JerungDetector #DeepagiScreener

Break Out signal!A significant price movement makes EMICO in a Break Out (BO) signal with high volume confirmed the price. EMICO also hits a new 52 weeks high price. MACD and OBV charts confirmed the Uptrend Pattern (UP). Is the price will be pushed down towards Bollinger Band (BB) upper limit? If yes, you might wan
EMICO STILL HAVE MOMENTUM?It show descending triangle pattern and it will retrace first 50% before it continue uptrend.
#TAYOR MYX:EMICO

EMICO Cup and HandleSuccessful BO with Cup and Handle.
Target 0.655/0.80 if successful Cup and Handle.

See all ideas
Trade directly on the supercharts through our supported, fully-verified and user-reviewed brokers.


Frequently Asked Questions
The current price of EMICO is 0.320 MYR — it hasn't changed in the past 24 hours. Watch EMICO HOLDINGS BHD stock price performance more closely on the chart.
Depending on the exchange, the stock ticker may vary. For instance, on MYX exchange EMICO HOLDINGS BHD stocks are traded under the ticker EMICO.
EMICO stock has fallen by 1.54% compared to the previous week, the month change is a 1.54% fall, over the last year EMICO HOLDINGS BHD has showed a 10.34% increase.
EMICO reached its all-time high on Apr 17, 2007 with the price of 0.955 MYR, and its all-time low was 0.080 MYR and was reached on Mar 17, 2020. View more price dynamics on EMICO chart.
See other stocks reaching their highest and lowest prices.
See other stocks reaching their highest and lowest prices.
EMICO stock is 0% volatile and has beta coefficient of −0.74. Track EMICO HOLDINGS BHD stock price on the chart and check out the list of the most volatile stocks — is EMICO HOLDINGS BHD there?
Today EMICO HOLDINGS BHD has the market capitalization of 42.08 M, it has decreased by 2.99% over the last week.
Yes, you can track EMICO HOLDINGS BHD financials in yearly and quarterly reports right on TradingView.
EMICO net income for the last quarter is −889.00 K MYR, while the quarter before that showed 1.16 M MYR of net income which accounts for −176.57% change. Track more EMICO HOLDINGS BHD financial stats to get the full picture.
No, EMICO doesn't pay any dividends to its shareholders. But don't worry, we've prepared a list of high-dividend stocks for you.
EBITDA measures a company's operating performance, its growth signifies an improvement in the efficiency of a company. EMICO HOLDINGS BHD EBITDA is 6.84 M MYR, and current EBITDA margin is 11.15%. See more stats in EMICO HOLDINGS BHD financial statements.
Like other stocks, EMICO shares are traded on stock exchanges, e.g. Nasdaq, Nyse, Euronext, and the easiest way to buy them is through an online stock broker. To do this, you need to open an account and follow a broker's procedures, then start trading. You can trade EMICO HOLDINGS BHD stock right from TradingView charts — choose your broker and connect to your account.
Investing in stocks requires a comprehensive research: you should carefully study all the available data, e.g. company's financials, related news, and its technical analysis. So EMICO HOLDINGS BHD technincal analysis shows the sell today, and its 1 week rating is sell. Since market conditions are prone to changes, it's worth looking a bit further into the future — according to the 1 month rating EMICO HOLDINGS BHD stock shows the buy signal. See more of EMICO HOLDINGS BHD technicals for a more comprehensive analysis.
If you're still not sure, try looking for inspiration in our curated watchlists.
If you're still not sure, try looking for inspiration in our curated watchlists.