Pecca, coming soon?There's something interesting happening with Pecca that might not have caught everyone's attention. While it's uncertain if things will go according to plan, the pattern observed around the last three ex-dividend dates shows a noticeable price pump.
Currently, the stock price is below most of the E
Next report date
—
Report period
—
EPS estimate
—
Revenue estimate
—
0.07MYR
35.40 MMYR
221.26 MMYR
145.04 M
About PECCA GROUP BERHAD
Sector
Industry
CEO
Ken Nee Foo
Website
Headquarters
Kuala Lumpur
Founded
2010
ISIN
MYL5271OO001
FIGI
BBG00CLF8L47
Pecca Group Bhd. is an investment holding company, which engages in styling, manufacturing, distribution, and installation of leather upholstery. It offers seat covers for the automotive and aviation industries. It operates through the following segments: Automotive, Healthcare, and Others. The Automotive segment offers car seat covers and accessories covers. The Healthcare segment includes manufacturing and distribution of healthcare products. The company was founded by Hwa Cheng Teoh on July 27, 2010 and is headquartered in Kuala Lumpur, Malaysia.

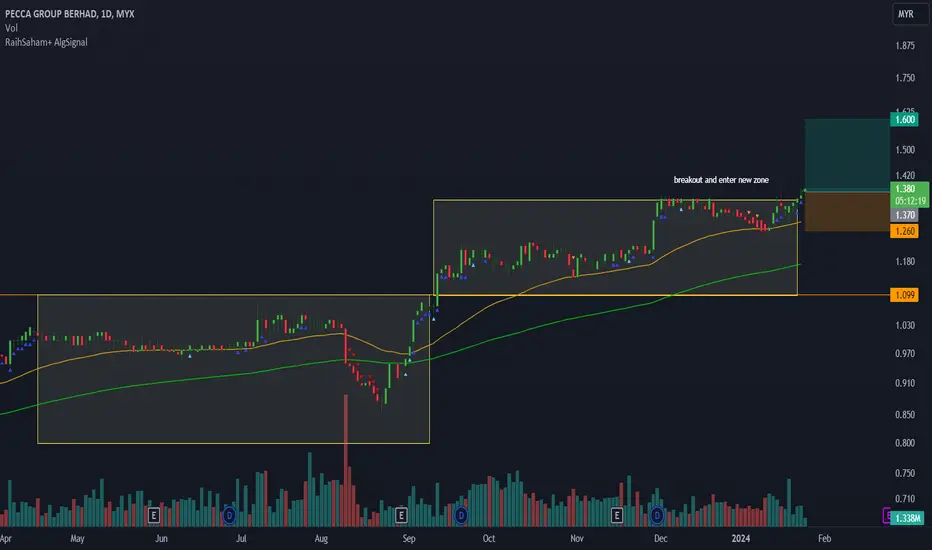
PECCA: AlgoSignal reveals potential uptrend.Several indicators within my algorithmic system are signaling a potential uptrend. These include:
- Increased volume: Activity is picking up, suggesting growing interest and potential momentum.
- Mid- to long-term uptrend: Both the 50-day and 150-day exponential moving averages are pointing upward,


HARBOUR, Uptrend based on AlgoSignal StrategyThe current point exhibits promising upward signals according to my algorithmic system, meeting various criteria. These include rising trading volume, an upward trend indicated by prices above EMA20 and EMA50, and the closing price surpassing VWAP. As a result, the present conditions suggest a poten

PECCA - TA1. Price candle break out MA 200 on 24 Aug '23 give strong signal the price movement may change direction to bullish soon.
2. Price candle testing MA 200 on 14 Aug '23 to 23 Aug '23 to shake out weak retailers. Next price candles break out MA 200 on 24 Aug '23.
3. GC (Golden Cross) MA 50 & MA 20 not

PECCA - should BOD (buy on dip)?Some question that traders or investor may think of, "should they BOD?"🤔
Think to consider before next step:
>> broken the uptrend pararrel channel.
>> price dropped more than -10% in a week.
>> price below Hull MA / red blue sea.
>> yet has any recovery signal, but when the signal come? Don't kn

PECCA Weekly Chart VCPWilliam O'Neil got a lot of weekly chart example in his book: How to Make Money in Stocks.
PECCA chart is hidden in daily chart. Amazing setup seen in weekly chart. The base of the chart used 770 days to form with below contraction:
C1: -43%
C2: -15%
C3: -6%
C4: -5%
Attempt breakout last week a

PECCA HUGE BASE VCP SETUPPECCA appear in the screener and look at this huge base >600 days VCP setup.
C1: -44%
C2: -16%
C3: -3%
QR yet to released, based on the early volume and price movement, expected good QR that will be released on 27th or 28th. Let's see if pull back after QR for better entry point or not.
Anyone s


See all ideas
Trade directly on the supercharts through our supported, fully-verified and user-reviewed brokers.


Frequently Asked Questions
The current price of PECCA is 1.24 MYR — it has increased by 1.64% in the past 24 hours. Watch PECCA GROUP BERHAD stock price performance more closely on the chart.
Depending on the exchange, the stock ticker may vary. For instance, on MYX exchange PECCA GROUP BERHAD stocks are traded under the ticker PECCA.
PECCA stock has fallen by 1.59% compared to the previous week, the month change is a 3.13% fall, over the last year PECCA GROUP BERHAD has showed a 16.98% increase.
PECCA reached its all-time high on Jun 4, 2024 with the price of 1.50 MYR, and its all-time low was 0.16 MYR and was reached on Mar 18, 2020. View more price dynamics on PECCA chart.
See other stocks reaching their highest and lowest prices.
See other stocks reaching their highest and lowest prices.
PECCA stock is 1.64% volatile and has beta coefficient of −0.42. Track PECCA GROUP BERHAD stock price on the chart and check out the list of the most volatile stocks — is PECCA GROUP BERHAD there?
Today PECCA GROUP BERHAD has the market capitalization of 917.17 M, it has decreased by 1.60% over the last week.
Yes, you can track PECCA GROUP BERHAD financials in yearly and quarterly reports right on TradingView.
PECCA GROUP BERHAD is going to release the next earnings report on Aug 28, 2024. Keep track of upcoming events with our Earnings Calendar.
PECCA net income for the last quarter is 14.05 M MYR, while the quarter before that showed 13.38 M MYR of net income which accounts for 5.01% change. Track more PECCA GROUP BERHAD financial stats to get the full picture.
PECCA GROUP BERHAD dividend yield was 2.34% in 2023, and payout ratio reached 50.11%. The year before the numbers were 2.06% and 11.42% correspondingly. See high-dividend stocks and find more opportunities for your portfolio.
EBITDA measures a company's operating performance, its growth signifies an improvement in the efficiency of a company. PECCA GROUP BERHAD EBITDA is 67.74 M MYR, and current EBITDA margin is 22.91%. See more stats in PECCA GROUP BERHAD financial statements.
Like other stocks, PECCA shares are traded on stock exchanges, e.g. Nasdaq, Nyse, Euronext, and the easiest way to buy them is through an online stock broker. To do this, you need to open an account and follow a broker's procedures, then start trading. You can trade PECCA GROUP BERHAD stock right from TradingView charts — choose your broker and connect to your account.
Investing in stocks requires a comprehensive research: you should carefully study all the available data, e.g. company's financials, related news, and its technical analysis. So PECCA GROUP BERHAD technincal analysis shows the sell today, and its 1 week rating is neutral. Since market conditions are prone to changes, it's worth looking a bit further into the future — according to the 1 month rating PECCA GROUP BERHAD stock shows the buy signal. See more of PECCA GROUP BERHAD technicals for a more comprehensive analysis.
If you're still not sure, try looking for inspiration in our curated watchlists.
If you're still not sure, try looking for inspiration in our curated watchlists.