SAMCHEM SWING TRADE SETUP1. High volume break out 29 April 2024
2. Price pull back with low volume to previous resistance, 20 and 50 MA
Wait for price to break above previous candle with increase volume
www.youtube.com
Next report date
Report period
Q1 2024
EPS estimate
—
Revenue estimate
—
0.055MYR
30.73 MMYR
1.16 BMYR
439.18 M
About SAMCHEM HOLDINGS BERHAD
Sector
Industry
CEO
Wee Yip Chong
Website
Headquarters
Shah Alam
Employees (FY)
235
Founded
1989
ISIN
MYL5147OO003
FIGI
BBG000BN61Y0
Samchem Holdings Bhd. is an investment holding company, which engages in the provision of management services. It operates through the Chemical Distribution and Blending, and Audio Video and ICT Distribution segments. The Chemical Distribution and Blending segment is involved in the distributing polyurethane, intermediate, and specialty chemicals; and blending of customized solvents. The Audio Video and ICT Distribution segment includes retail sale and repair services. The company was founded on January 13, 1989 and is headquartered in Shah Alam, Malaysia.

Samchem, potential rebound or continue pullback?>> base on 1h, it may continue to pullback
>> 565 area for potential rebound, if price above to support.
Let see how it work.
When a stock / index has gone up substantially, we must be more care if we decide to get involve in it...
monitor closely and be agile....
we cannot PREDICT what definitel

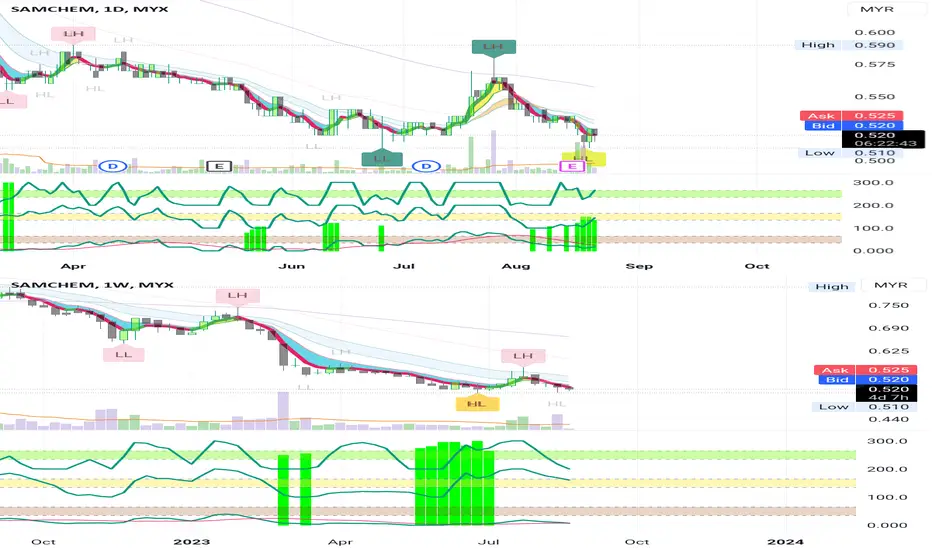
SAMCHEM - Potential to bounce higher?Very obvious it's a downtrend stock.
Some afraid of catching the falling knife.
However, base on :
>> weekly chart, it show a potential rebound as long as the price stay above 510 and brake above 530.
>> day chart, it may slightly retrace. Best is stay above blue cloud ☁️ EMA. Let it form an up
SAMCHEM is it Ready for Departure?SAMCHEM is it Ready for Departure this third time around?
Station 1.06 gonna could be a tough call! However with the in-coming results...will it make the difference?
Disclaimer: The chart shared here, attracts the writer's attention. It is author's view...and there is no guarantee on the movement

VCP for Sanchem?VCP in making for Samchem?
Possible trading strategy
1. Bottom trendline can be good entry point as long as price moving in between the triangle.
2. Breaking out above VCP triangle potential major uptrend coming.
Cautious
1. Breaking below triangle should consider for first signal cut lose while

<TradeVSA> Re-Accumulation with VCP - SAMCHEMSign of Strength in the chart:
1. VCP Setup with no Sign of Distribution
2. Potential CoC
Disclaimer
This information only serves as reference information and does not constitute a buy or sell call. Conduct your own research and assessment before deciding to buy or sell any stock

SAMCHEM- COLLECTION 0.80-0.82 (TARGET 15-20%)IDEAS:
1. Good building of overall technical strength, BBD in positive zone.
2. Looking forward for a 15-20% gain.

SAMCHEM potential upside TP 0.930Our BMS technical chart detected Signal 2 bullish signal and we see potential to revisit near term resistance TP at 0.930. Immediate support at 0.780.
Once breakout XMA3 at 0.840 and with support of volume price will move higher.

SAMCHEM IN ABC FORMATIONCan study and monitor SAMCHEM's chart pattern. From 0.650 swing low on 5 August 2021 to a swing high of 1.070 (ie 52wh) on 25 October 2021, SAMCHEM retraced to 0.770 which is in-between fibo786 and 618 levels. At present, SAMCHEM's price has crossed EMA200 and fibo618. Probable EP would be 0.820 to

Momentum play- SAMCHEM BHDPrice able to closed at previous high RM0.92
Really good market sentiment last Friday.
Company making higher revenue.
Keep monitor for proper entry-point

See all ideas
Trade directly on the supercharts through our supported, fully-verified and user-reviewed brokers.


Frequently Asked Questions
The current price of SAMCHEM is 0.620 MYR — it has decreased by 1.59% in the past 24 hours. Watch SAMCHEM HOLDINGS BERHAD stock price performance more closely on the chart.
Depending on the exchange, the stock ticker may vary. For instance, on MYX exchange SAMCHEM HOLDINGS BERHAD stocks are traded under the ticker SAMCHEM.
SAMCHEM HOLDINGS BERHAD is going to release the next earnings report on May 15, 2024. Keep track of upcoming events with our Earnings Calendar.
SAMCHEM stock is 2.44% volatile and has beta coefficient of 1.24. Track SAMCHEM HOLDINGS BERHAD stock price on the chart and check out the list of the most volatile stocks — is SAMCHEM HOLDINGS BERHAD there?
Yes, you can track SAMCHEM HOLDINGS BERHAD financials in yearly and quarterly reports right on TradingView.
SAMCHEM stock has risen by 1.64% compared to the previous week, the month change is a 1.64% rise, over the last year SAMCHEM HOLDINGS BERHAD has showed a 9.73% increase.
SAMCHEM net income for the last quarter is 10.35 M MYR, while the quarter before that showed 8.49 M MYR of net income which accounts for 21.91% change. Track more SAMCHEM HOLDINGS BERHAD financial stats to get the full picture.
Today SAMCHEM HOLDINGS BERHAD has the market capitalization of 337.28 M, it has increased by 1.67% over the last week.
SAMCHEM HOLDINGS BERHAD dividend yield was 3.87% in 2023, and payout ratio reached 42.48%. The year before the numbers were 4.78% and 41.29% correspondingly. See high-dividend stocks and find more opportunities for your portfolio.
Like other stocks, SAMCHEM shares are traded on stock exchanges, e.g. Nasdaq, Nyse, Euronext, and the easiest way to buy them is through an online stock broker. To do this, you need to open an account and follow a broker's procedures, then start trading. You can trade SAMCHEM HOLDINGS BERHAD stock right from TradingView charts — choose your broker and connect to your account.
SAMCHEM reached its all-time high on Oct 25, 2021 with the price of 1.070 MYR, and its all-time low was 0.145 MYR and was reached on Mar 12, 2013. View more price dynamics on SAMCHEM chart.
See other stocks reaching their highest and lowest prices.
See other stocks reaching their highest and lowest prices.
As of May 4, 2024, the company has 235.00 employees. See our rating of the largest employees — is SAMCHEM HOLDINGS BERHAD on this list?
Investing in stocks requires a comprehensive research: you should carefully study all the available data, e.g. company's financials, related news, and its technical analysis. So SAMCHEM HOLDINGS BERHAD technincal analysis shows the buy rating today, and its 1 week rating is buy. Since market conditions are prone to changes, it's worth looking a bit further into the future — according to the 1 month rating SAMCHEM HOLDINGS BERHAD stock shows the buy signal. See more of SAMCHEM HOLDINGS BERHAD technicals for a more comprehensive analysis.
If you're still not sure, try looking for inspiration in our curated watchlists.
If you're still not sure, try looking for inspiration in our curated watchlists.
EBITDA measures a company's operating performance, its growth signifies an improvement in the efficiency of a company. SAMCHEM HOLDINGS BERHAD EBITDA is 42.59 M MYR, and current EBITDA margin is 3.80%. See more stats in SAMCHEM HOLDINGS BERHAD financial statements.