Option Alert: $AMZN NOV 07 2025 $220 Calls – 118% ROI Potential Enter: NASDAQ:AMZN NOV 07 2025 $220 CALLS
Buy in Price: $8.60 - $8.65
Take Profit: $18.75
Stop Bleeding: $7.57
ROI Potential: 118%
Exit Within: 2 Weeks
Trade ideas
Option Alert: $AMZN NOV 07 2025 $220 Calls – 118% ROI Potential Enter: NASDAQ:AMZN NOV 07 2025 $220 CALLS
Buy in Price: $8.60 - $8.65
Take Profit: $18.75
Stop Bleeding: $7.57
ROI Potential: 118%
Exit Within: 2 Weeks

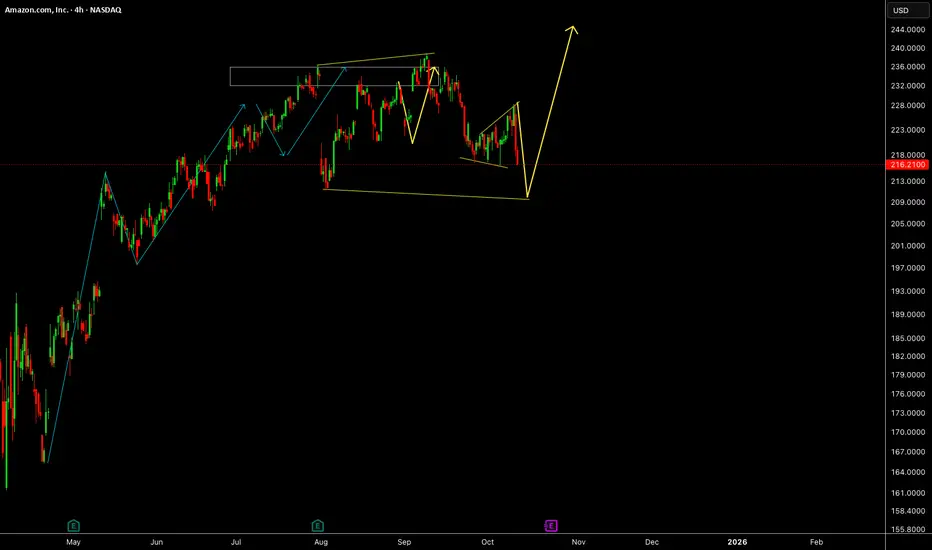
Amazon end of accumulation and expansion will beginAmazon has likely completed its accumulation phase and is showing signs of renewed bullish momentum. A breakout above recent resistance could confirm the start of a new upward trend.
Levels to watch: 232 - 252
⚠️ Not financial advice.

Ethereum is headed for a massive bull market. Hope you guys are ready for the fun part, because Ethereum—according to my analysis—is ready for some massive moves. This means altcoin season is coming in full force very soon. Be ready and ignore the FUD.
As always, stay profitable.
– Dalin Anderson

Amazon (AMZN) – Testing the Breaking Point! Will Buyers Step In or Is a Bigger Drop Coming?
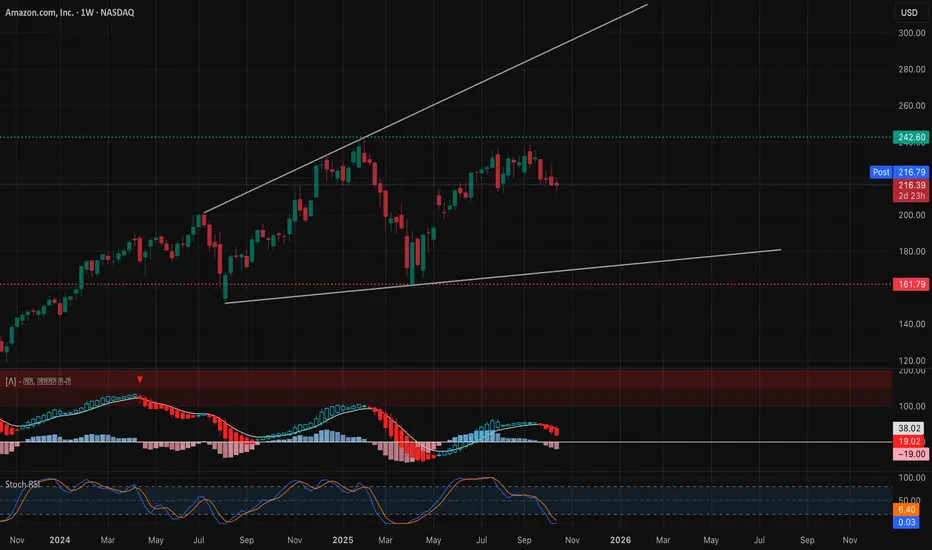
🧭 Weekly Chart – Macro Market Structure
Amazon’s weekly chart reveals a consolidation at the top of a long-term ascending channel, with clear exhaustion signs showing after months of strong accumulation. The structure printed a CHoCH (Change of Character) below the $242 resistance zone, signaling that sellers are regaining control short-term.
Price is now hovering around $197–$216, right above the key structural support that has held since mid-2024. The BOS (Break of Structure) at $197.9 last quarter remains unchallenged, so buyers still have a chance to defend this level.
However, the weekly MACD is flattening after a bearish crossover, and Stoch RSI at 76.9 shows the overbought cooling phase isn’t done yet.
* If $216 fails, expect a deeper retracement to $197 or even $182–$185, aligning with the lower trendline of the macro channel.
* If $220 reclaims, we could see a rebound toward $238–$242, the major supply zone where previous liquidity was swept.
Weekly Summary: Structure still bullish long-term, but short-term correction risk remains high. Bulls must defend $197–$211 zone to prevent a deeper downtrend shift.
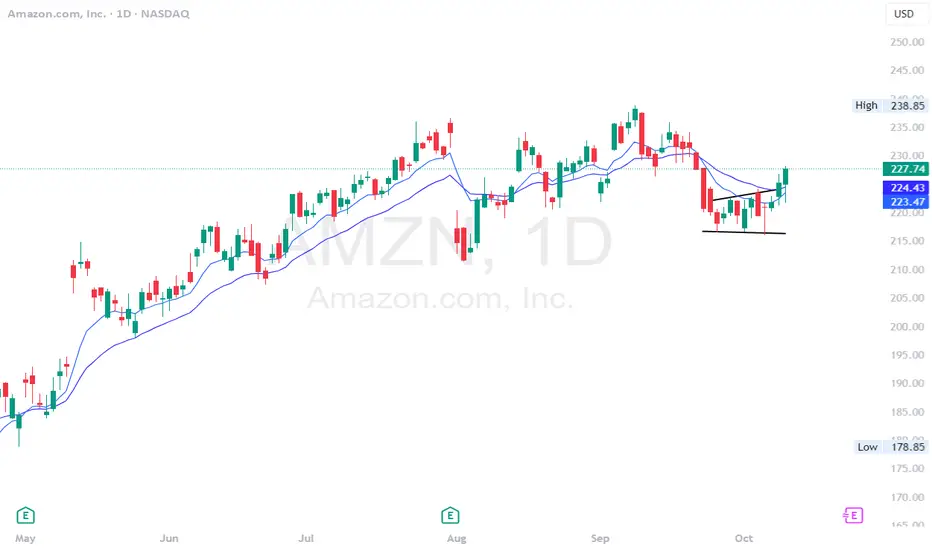
⚙️ Daily Chart – Mid-Term Battle Zone
The daily chart paints a more tactical story: AMZN has just confirmed another BOS down while bouncing along the ascending trendline from April. A repeated liquidity grab near $211–$212 has kept price inside this structure.
The 9 EMA has crossed below the 21 EMA, confirming short-term bearish momentum. But the MACD is beginning to flatten, hinting that sellers may be losing steam.
* Bullish Scenario: If AMZN reclaims $218–$220, it opens room for recovery toward $226, then $232 (previous fair value gap and GEX wall zone).
* Bearish Scenario: A daily close below $211.50 would invalidate the local support, triggering continuation toward $197.50 and eventually $182 if the momentum snowballs.
Daily Bias: Neutral-to-bearish until buyers reclaim $220. Still range-bound, but the risk/reward favors patience until structure confirmation.
⏱ 1-Hour Chart – Short-Term Trading Plan
The 1-hour chart shows multiple CHoCH and BOS rotations, forming a clear descending range between $210–$228. The structure is still bearish overall, but the most recent BOS up with bullish divergence on MACD and Stoch RSI indicates potential for a short-term bounce.
Volume profile shows absorption below $212 — that’s where smart money likely reloaded positions.
* Trading Plan:
* Bullish setup: Above $217.5, target $222.5 → $228, stop below $214.5.
* Bearish setup: Below $211.5, short toward $205, stop above $215.
If $217.5 breaks with volume, intraday momentum can accelerate fast toward $222 where heavy GEX call wall aligns.
Short-Term Bias: Accumulation phase in progress. Expect choppy rebounds until one side breaks structure decisively.
💥 Options GEX & Institutional Positioning
From the Options GEX snapshot:
* Highest positive GEX (Call Wall): $222 → Key resistance / potential short-term magnet if breakout happens.
* 2nd Call Wall: $227.5 → strong gamma resistance, aligns with upside fade zone.
* Major PUT Support: $210 (–56.9% GEX) → strong liquidity and protection level.
* IVR 46.4 / IVx 44.4 → elevated volatility, great for traders who prefer spreads over straight directional bets.
Gamma Flow Interpretation: Market makers are heavily neutralized between $215–$220. Above $220, delta hedging could force a rapid squeeze. Below $211, negative gamma expands volatility and drives deeper flushes.
🎯 Option Strategy Suggestions
1️⃣ Bullish Play:
* Buy $220C / Sell $230C (Oct 25 expiry) → captures breakout to $230, limited risk and defined reward.
* For fast momentum: Buy 0DTE/2DTE $217.5 Calls once $218 breaks with strong volume.
2️⃣ Bearish Hedge:
* If $211 breaks, Buy $210P / Sell $200P (Oct 18 expiry) — clean structure for downside continuation.
3️⃣ Neutral Income Play:
* Expecting consolidation? Sell Iron Condor: $230C/$235C + $205P/$200P — capitalize on theta decay while AMZN stays trapped.
💬 Final Thoughts
AMZN is at a critical inflection point — it’s neither fully broken down nor ready to rally yet. This $211–$218 pocket is the battlefield. Bulls reclaiming $220 flips the narrative back to bullish continuation. Bears breaking $211 unlocks a path to $197.
My TA continues to show high win-rate precision, and traders can verify from past history that levels often react exactly as mapped.
If you want me to break down any stock that I don’t regularly post, DM me — I’ll be happy to TA it for you.
This analysis is for educational purposes only and does not constitute financial advice. Always do your own research and manage your risk before trading.

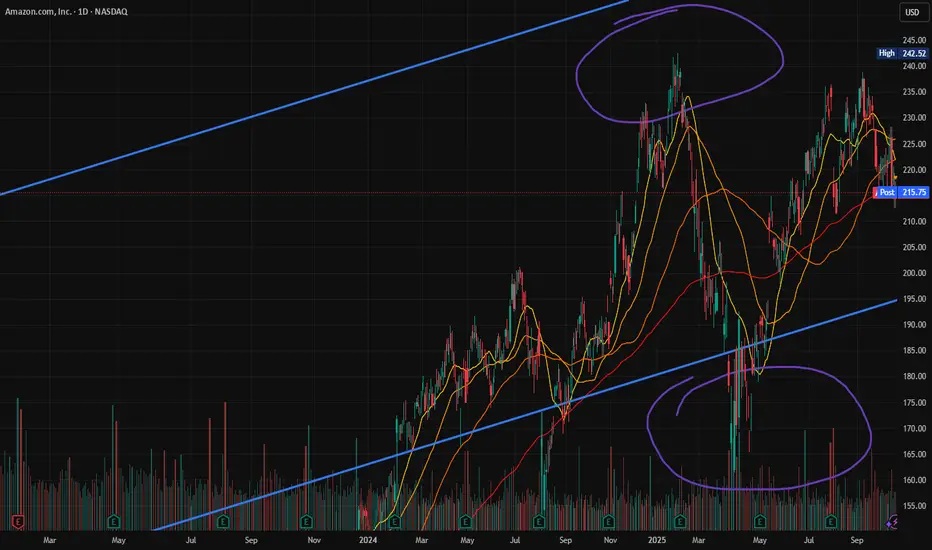
AMZN longAmazon is my most prominent position now with 800 shares. I have been accumulating heavily down here, as I expect a Google-like move from this mega-cap. The market has largely overlooked the fact that they have outpaced Google and Meta in ad growth, despite facing strong robotic and AI headwinds. Even a 1% increase in margins increases their earnings by about $ 7 billion.
Looking at the chart, we are positioned above a recent demand zone, with a Bezos sell wall at the supply. We recently flashed blue on volatility, indicating tremendous upside potential, and momentum has reset. I look for momentum to retest the teal line.

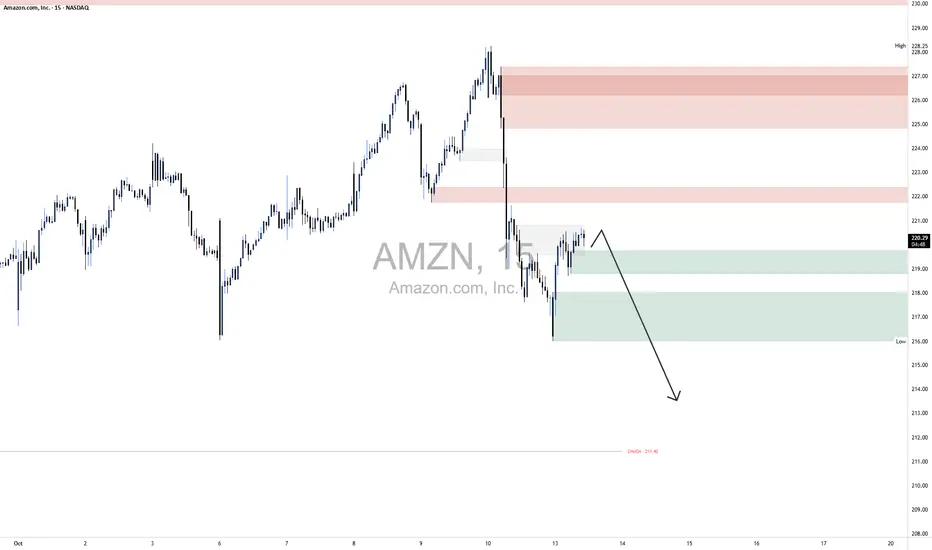
AMZN ShortThe broader market structure on AMZN (15-minute) is bearish, confirmed by a decisive Change of Character (CHoCH) near $226.46, followed by a Break of Structure (BOS) as price pushed below the prior higher low around $220.80. This transition from higher highs to lower lows confirms that sellers have taken control, and the overall direction now favors a continuation to the downside.
Looking at the supply and demand dynamics, the upper supply zones between $223–$226 and $227–$228 are strong, as each has previously triggered sharp, high-volume declines—showing clear signs of institutional selling pressure. In contrast, the lower demand zones between $217–$219 appear relatively weak after price broke through them aggressively before consolidating. Buyers attempted to step in here but failed to create higher highs, indicating that this demand could serve as a short-term reaction area rather than a strong reversal base.
Within the marked region, price is currently hovering just above the $219–$218 demand range after a shallow pullback. The current price action shows compression toward the downside with lower wicks but no impulsive bullish candles—suggesting that sellers are absorbing buy orders. A minor push higher into $220.80–$221.20 could occur to mitigate remaining imbalance before the next leg down toward $215–$214.
From a footprint analysis perspective, we’d expect to see heavy sell imbalances within the recent drop and limited buy delta absorption in the current consolidation, signaling that selling pressure remains dominant. A brief uptick in positive delta during any pullback would likely represent short covering rather than genuine buying strength.
Trade bias: bearish continuation. Expect price to react lower from the $220.80–$221.20 range and target the $215–$214 area next.
Invalidation level: a sustained break and close above $222.00, which would suggest a possible structural shift or deeper retracement toward higher supply at $224–$226.
Momentum: still favors sellers; buyers have yet to show a convincing recovery candle or delta flip.
$AMZN Tradespoon – Long Entry $227.74Tradespoon model generated long signal for NASDAQ:AMZN . Predicted range: $220.98–$229.14. Trend: +0.25%. NASDAQ:AMZN

Carbon Credits and ESG Futures in Trading1. Understanding Carbon Credits
1.1 What Are Carbon Credits?
A carbon credit represents a certificate that allows the holder to emit one metric ton of carbon dioxide (CO₂) or its equivalent in other greenhouse gases (GHGs). The system emerged under the Kyoto Protocol (1997) and later expanded through the Paris Agreement (2015), as nations agreed to cap emissions and trade carbon units as a market-based solution to climate change.
There are two main types of carbon markets:
Compliance Markets: Regulated by national or regional governments, where entities must adhere to emission caps. Examples include the EU Emissions Trading System (EU ETS) and California Cap-and-Trade Program.
Voluntary Markets: Corporations and individuals purchase carbon credits to offset their emissions voluntarily. These markets are less regulated but rapidly growing, driven by corporate net-zero commitments.
Each carbon credit signifies a verified reduction or removal of greenhouse gases—achieved through reforestation, renewable energy projects, carbon capture, or energy efficiency programs.
1.2 The Mechanics of Carbon Trading
Carbon trading operates on a “cap-and-trade” principle. Governments or international bodies set a limit (cap) on total emissions allowed. Companies receive or buy emission allowances and can trade them based on their performance:
Emit less than their allowance: The company can sell excess credits for profit.
Emit more than their allowance: The company must buy additional credits or face penalties.
This mechanism incentivizes industries to innovate, cut emissions, and invest in green technologies. Market prices fluctuate based on supply, demand, and policy shifts—similar to commodities or financial assets.
1.3 Growth of Carbon Credit Markets
Global carbon markets have grown exponentially. According to the World Bank’s State and Trends of Carbon Pricing 2024, over 73 carbon pricing initiatives are now in operation worldwide, covering 23% of global emissions. The EU ETS remains the largest, with carbon prices crossing €80 per ton in 2024.
Meanwhile, voluntary carbon markets (VCMs) are expanding, with corporate demand driven by sustainability commitments from firms like Microsoft, Amazon, and Shell. VCMs surpassed $2 billion in annual value by 2024, with projections suggesting potential growth to $50 billion by 2030.
2. ESG Futures: A New Dimension in Sustainable Trading
2.1 Defining ESG Futures
ESG futures are derivative contracts that allow investors to gain or hedge exposure to companies or indices with high ESG ratings. These futures mirror traditional equity index futures but are based on ESG-screened indices, such as the S&P 500 ESG Index or MSCI ESG Leaders Index.
By trading ESG futures, investors can align portfolios with sustainability values while maintaining liquidity and risk management capabilities. These instruments also encourage companies to improve ESG performance to attract capital.
2.2 Evolution of ESG Derivatives
The concept of ESG-linked derivatives emerged in the late 2010s. The Eurex Exchange launched the first ESG futures in 2019, tracking the STOXX Europe 600 ESG-X Index. Since then, exchanges like CME Group, NASDAQ, and ICE have introduced ESG-linked futures and options.
These products have gained momentum as global investors, including pension funds and sovereign wealth funds, prioritize sustainability. By 2024, ESG derivative volumes exceeded $200 billion, reflecting strong institutional demand for green financial instruments.
2.3 Mechanics of ESG Futures
ESG futures function similarly to equity index futures:
Underlying Asset: ESG-screened index or basket of sustainable companies.
Contract Size: Typically based on a fixed multiple of the index level.
Settlement: Usually cash-settled at contract expiration.
Trading Purpose: Speculation, hedging, or portfolio alignment with ESG principles.
Traders can go long on ESG futures to express bullish sentiment on sustainable companies or short to hedge existing ESG exposures. They offer transparency, liquidity, and alignment with responsible investment mandates.
3. Intersection of Carbon Credits and ESG Futures
The convergence of carbon credits and ESG futures represents a powerful evolution in sustainable finance. While carbon credits directly incentivize emission reduction, ESG futures provide a broader investment framework that integrates environmental responsibility into financial markets.
Investors are increasingly using carbon intensity metrics within ESG models, linking corporate emission performance to financial instruments. Companies that effectively manage carbon risks often score higher on ESG indices, thereby influencing their inclusion in ESG futures benchmarks.
Moreover, hybrid instruments such as “carbon-neutral futures” are emerging—contracts that offset trading emissions through carbon credit purchases, symbolizing the fusion of environmental and financial innovation.
4. Role of Financial Institutions and Exchanges
4.1 Exchange Innovations
Major exchanges are leading the charge in green trading:
CME Group launched Nature-Based Global Emissions Offsets (N-GEO) and Global Emissions Offset (GEO) futures.
Eurex expanded its ESG product suite to include ESG-X and Low Carbon Index futures.
ICE (Intercontinental Exchange) operates one of the largest carbon trading platforms, integrating compliance and voluntary markets.
These platforms enhance price discovery, transparency, and global participation in carbon and ESG markets.
4.2 Institutional Involvement
Institutional investors are pivotal in driving demand for sustainable instruments. Asset managers, insurers, and pension funds are integrating ESG futures and carbon pricing mechanisms into their asset allocation models.
For instance, BlackRock, Vanguard, and UBS have expanded ESG investment portfolios that utilize derivatives for risk management and exposure optimization. Banks, including Goldman Sachs and HSBC, now facilitate carbon trading desks to meet corporate demand for offset solutions.
5. Benefits of Carbon and ESG Trading
Environmental Impact: Encourages carbon reduction and sustainable practices across industries.
Market Efficiency: Introduces price signals for emissions and sustainability, guiding capital allocation.
Portfolio Diversification: Provides new asset classes and hedging opportunities.
Corporate Accountability: Promotes transparency in reporting and responsible governance.
Economic Opportunity: Creates green jobs, investment opportunities, and technology innovation.
6. Challenges and Criticisms
Despite their promise, carbon and ESG markets face significant challenges:
Greenwashing: Some firms exaggerate sustainability credentials to attract investment.
Standardization Issues: Lack of uniform ESG metrics complicates index construction and comparability.
Verification and Integrity: In carbon markets, concerns persist about double-counting and unreliable offsets.
Market Volatility: Regulatory shifts and geopolitical tensions can cause price instability.
Accessibility: Developing nations often struggle to access or benefit equally from carbon finance.
Regulatory bodies such as the International Organization of Securities Commissions (IOSCO) and the Task Force on Climate-related Financial Disclosures (TCFD) are working to address these gaps by promoting transparency and accountability.
7. Global Policy and Regulatory Landscape
The regulatory framework supporting carbon and ESG trading is expanding globally:
European Union: The EU ETS remains the backbone of global carbon pricing, complemented by the Corporate Sustainability Reporting Directive (CSRD).
United States: The CFTC and SEC are enhancing ESG disclosure requirements, while regional carbon markets continue to grow.
Asia-Pacific: China’s national carbon market, launched in 2021, now covers over 4 billion tons of emissions annually.
India: Introduced a Carbon Credit Trading Scheme (CCTS) in 2023, marking a major step in sustainable finance integration.
These initiatives ensure that markets remain transparent, fair, and aligned with climate commitments.
8. The Role of Technology in ESG and Carbon Trading
Digital innovation is revolutionizing sustainable finance. Blockchain ensures traceability of carbon credits, preventing fraud and double-counting. Platforms such as KlimaDAO and Toucan Protocol are tokenizing carbon credits, enabling decentralized trading.
Artificial Intelligence (AI) and Big Data enhance ESG scoring accuracy and climate risk modeling. Meanwhile, satellite monitoring verifies emission reductions from forestry and land-use projects, improving credit integrity.
Such technologies are vital for scaling carbon and ESG markets while maintaining credibility.
9. Future Outlook: The Path Toward Sustainable Markets
The future of trading will be deeply intertwined with sustainability principles. As the global push toward net-zero intensifies, carbon credits and ESG futures are expected to become mainstream financial instruments.
Experts forecast that by 2030, carbon prices may exceed $100 per ton, making emissions a significant financial consideration. Similarly, ESG-linked derivatives are projected to grow tenfold, as investors demand transparency and alignment with global sustainability goals.
Financial systems are transitioning from short-term profit maximization to long-term value creation, balancing climate impact with economic growth. This shift signifies a new era where environmental performance becomes a financial advantage.
10. Conclusion
The fusion of carbon credits and ESG futures represents a defining transformation in global trading. No longer are sustainability and finance separate domains; they are now deeply interconnected. Carbon markets internalize the cost of pollution, while ESG futures reward ethical, responsible behavior.
As nations, corporations, and investors rally behind net-zero ambitions, these markets will play a pivotal role in reallocating capital toward green growth. Challenges remain—standardization, transparency, and global equity—but innovation and regulation are steadily bridging these gaps.
Ultimately, the rise of carbon credits and ESG futures marks the dawn of sustainable capitalism—where financial prosperity and planetary well-being move hand in hand. The traders and investors who embrace this paradigm will not only capture economic returns but also contribute to the preservation of the planet for future generations.
AmazonAmazon has given us small push up but slow last week, we will expect some more drop this week before a major push up.
Disclosure: We are part of Trade Nation's Influencer program and receive a monthly fee for using their TradingView charts in our analysis.
Option Alert: $AMZN OCT 31 2025 $220 Calls – 41% ROI Potential Enter: NASDAQ:AMZN OCT 31 2025 $220 CALLS
Buy in Price: $9.64 - $9.70
Take Profit: $13.59
Stop Bleeding: $8.48
ROI Potential: 41%
Exit Within: 335 Minutes

$AMZN bearish batAmazon reached the reversal zone (0.886 fib level) consolidated then broke down. will wait for further price decline and consolidation.

$AMZN - breakout move incomingAMZN - Stock breaking out of consolidation channel on the daily. seeing multiple call flow come in. calls above $230 look good for a breakout move towards all time highs and $250. Stock is strong on indicators.
Global Equities Under PressureIntroduction
Global equity markets have long served as the pulse of the world economy, reflecting investor sentiment, corporate performance, and macroeconomic stability. Yet, in recent years, equities have come under immense pressure due to a combination of economic uncertainties, geopolitical tensions, inflationary trends, and shifting monetary policies. From Wall Street to emerging markets in Asia and Latin America, investors are grappling with heightened volatility and declining valuations. The phrase “global equities under pressure” encapsulates a broader narrative — one that intertwines economic cycles, policy shifts, and behavioral finance in a world increasingly influenced by interconnected risks.
This essay explores the multiple dimensions behind the sustained pressure on global equities. It examines macroeconomic factors such as inflation and interest rates, geopolitical instability, technological disruption, and investor psychology. It also discusses the impact on different regions, sectors, and investment strategies, before concluding with insights on the long-term outlook and possible recovery paths.
1. Understanding Global Equities and Market Dynamics
Equity markets represent ownership in publicly traded corporations, and their prices are primarily influenced by expectations of future earnings and overall economic performance. Global equity markets include major indices such as the S&P 500 (U.S.), FTSE 100 (U.K.), DAX (Germany), Nikkei 225 (Japan), Shanghai Composite (China), and NIFTY 50 (India).
When equities are “under pressure,” it means that broad indices are declining, investor confidence is weakening, and risk appetite is diminishing. Pressure on equities often arises when macroeconomic and geopolitical uncertainties cloud future earnings visibility or when liquidity conditions tighten due to changes in central bank policy.
The modern global equity landscape is also highly interconnected. With the expansion of cross-border capital flows, what happens in the U.S. Federal Reserve or the Chinese property market can have ripple effects across continents. This interdependence amplifies both growth opportunities and systemic risks.
2. Key Drivers of Pressure on Global Equities
2.1 Rising Inflation and Tightening Monetary Policies
One of the most prominent factors pressuring global equities in recent years has been persistent inflation. Post-pandemic economic recovery led to strong demand, while supply chain bottlenecks and commodity price shocks—particularly in energy and food—drove inflation to multi-decade highs.
Central banks responded with aggressive interest rate hikes. The U.S. Federal Reserve, the European Central Bank (ECB), and the Bank of England all shifted from near-zero rates to the highest levels in over a decade. Higher interest rates raise borrowing costs for companies, reduce consumer spending, and lower the present value of future corporate earnings—all of which weigh heavily on equity valuations.
In emerging markets, the situation has been even more acute. Countries with large dollar-denominated debt faced increased repayment burdens as the U.S. dollar strengthened. This led to capital outflows and further declines in local stock markets.
2.2 Geopolitical Tensions and Global Fragmentation
The world has witnessed heightened geopolitical instability: the Russia-Ukraine conflict, tensions between the U.S. and China, and conflicts in the Middle East have all disrupted global trade and energy markets. Sanctions, supply chain realignments, and military uncertainties have created a complex investment environment.
For example, the war in Ukraine triggered a surge in oil and natural gas prices, increasing input costs for manufacturing companies and reducing profitability. Similarly, U.S.-China tensions over technology exports and semiconductor supply chains have pressured tech stocks globally.
Geopolitical risk also undermines investor sentiment, leading to “risk-off” behavior, where investors pull money from equities and move to safe-haven assets like U.S. Treasuries, gold, or the Swiss franc.
2.3 Economic Slowdown and Recession Fears
As interest rates rise, economic growth slows. Many advanced economies are teetering on the edge of recession. Lower consumer spending and weaker industrial activity reduce corporate revenues and profit margins.
In the U.S., for example, fears of a “hard landing” have led analysts to cut earnings forecasts for major corporations. In Europe, energy costs and sluggish demand have hit industrial output. Meanwhile, China’s post-COVID recovery has been uneven, with the property sector crisis and deflationary pressures dampening market confidence.
The synchronized slowdown across major economies has contributed to a global equity selloff, as investors anticipate lower earnings growth worldwide.
2.4 Technological and Sectoral Realignments
Technology stocks, which led the equity rally during the 2010s and the pandemic years, have come under pressure as valuations corrected. Companies like Apple, Amazon, and Meta faced investor scrutiny as their price-to-earnings ratios soared to unsustainable levels.
The rise of artificial intelligence (AI) has provided new momentum to some tech firms, yet concerns about regulatory oversight, data privacy, and job displacement have introduced new volatility. Additionally, sectors like renewable energy, fintech, and biotech—once considered future growth engines—are now facing profitability challenges amid tighter financial conditions.
2.5 Currency Volatility and Global Capital Flows
Currency movements play a critical role in global equity performance. When the U.S. dollar strengthens, it becomes more expensive for foreign investors to buy American stocks, and it erodes earnings for multinational companies that earn revenue abroad. Conversely, emerging markets often experience capital flight during periods of dollar strength, leading to double pressure on equities and currencies.
For instance, investors withdrawing capital from developing markets to invest in higher-yielding U.S. assets can trigger sharp declines in those markets’ equity indices. Countries like Turkey, Argentina, and South Africa have experienced such cycles repeatedly.
2.6 Investor Sentiment and Behavioral Factors
Equity markets are not only driven by fundamentals but also by psychology. During periods of uncertainty, investors tend to react emotionally—selling in panic or buying on speculative hope. Behavioral finance suggests that herd behavior, loss aversion, and confirmation bias often amplify market volatility.
Institutional investors, hedge funds, and retail traders increasingly rely on algorithmic and high-frequency trading, which can exacerbate short-term swings. Social media and online trading platforms have also democratized participation but sometimes fuel irrational exuberance or fear.
3. Regional Impact Analysis
3.1 United States
The U.S. remains the world’s largest equity market. Its indices, particularly the S&P 500 and Nasdaq, are heavily influenced by mega-cap technology firms. The Federal Reserve’s monetary tightening and persistent inflation have led to valuation corrections, though AI-driven optimism has created pockets of resilience.
Earnings growth has slowed, with many firms facing margin pressure from rising labor costs. However, the U.S. market retains structural strengths such as innovation capacity, deep liquidity, and institutional trust.
3.2 Europe
Europe’s equity markets face a unique combination of challenges—energy dependency, demographic aging, and slow productivity growth. The Euro Stoxx 50 index has remained volatile, with energy and banking sectors performing relatively better than technology and industrials.
The ECB’s delayed but determined tightening cycle, combined with fiscal constraints in countries like Italy and France, has weighed on growth expectations. Moreover, political uncertainty—from Brexit aftermath to nationalist movements—continues to cloud long-term investment confidence.
3.3 Asia-Pacific
Asia’s equity landscape is diverse. China’s markets have suffered from the property sector collapse, weak consumer demand, and regulatory crackdowns on technology firms. Japan’s equities have seen renewed foreign investor interest amid corporate governance reforms and yen weakness. India, however, has emerged as a bright spot, with strong GDP growth, domestic liquidity, and digital transformation driving equity resilience.
Southeast Asia and Australia are also facing mixed conditions—benefiting from commodities demand but vulnerable to global trade disruptions.
3.4 Emerging Markets
Emerging markets have been hit hardest by global equity pressures. Capital outflows, debt burdens, and political instability have combined to reduce valuations. However, selective opportunities remain in markets with strong domestic demand, stable governance, and commodity exports.
Countries like Brazil and Indonesia, rich in natural resources, have benefited from the green transition and commodity upcycles, while others like Turkey and Argentina struggle with inflation and currency instability.
4. Sectoral Breakdown
Technology: Under pressure due to regulatory scrutiny and valuation corrections. AI is a bright spot but concentrated in few companies.
Energy: Oil and gas companies have benefited from supply constraints but face long-term sustainability questions.
Financials: Banks enjoy higher interest margins but face credit risks as economies slow.
Healthcare: Remains defensive amid uncertainty, supported by aging populations.
Consumer Goods: Facing cost pressures and reduced discretionary spending.
Industrial & Manufacturing: Impacted by supply chain realignment and higher input costs.
Real Estate: One of the most affected sectors due to rising interest rates and declining property valuations.
5. Broader Consequences of Equity Market Pressure
5.1 Wealth Effect and Consumer Confidence
Falling stock prices reduce household wealth and investor confidence, leading to lower consumption. This “negative wealth effect” can slow economic recovery and deepen recessions.
5.2 Corporate Financing Challenges
Lower valuations restrict companies’ ability to raise capital via equity issuance. Firms may resort to debt financing, which becomes more expensive in a high-rate environment, further pressuring balance sheets.
5.3 Pension Funds and Institutional Investors
Pension funds rely on equity returns to meet long-term liabilities. Sustained declines threaten their solvency and may push them toward riskier investments in search of yield.
5.4 Policy Implications
Persistent equity weakness can influence central bank decisions, as policymakers weigh financial stability alongside inflation control. Governments may introduce fiscal measures or stimulus programs to support growth.
6. Strategic Responses and Investor Adaptation
Investors are adapting to the new environment in several ways:
Diversification: Expanding portfolios across asset classes, including commodities, bonds, and alternative investments.
Value Investing Revival: Renewed interest in companies with strong cash flows, dividends, and low debt.
Focus on Quality: Preference for firms with resilient balance sheets, competitive advantages, and pricing power.
Sustainability and ESG: Increased focus on long-term sustainability, ethical governance, and climate resilience.
Geographic Rotation: Shifting capital from developed markets to select emerging markets with favorable demographics.
7. The Road Ahead: Outlook for Global Equities
While the current environment is challenging, it also presents opportunities for long-term investors. Historically, equity markets recover from downturns stronger than before, driven by innovation, productivity gains, and cyclical rebounds.
Short-Term (1–2 years): Continued volatility expected as inflation moderates but remains above target, and geopolitical risks persist.
Medium-Term (3–5 years): Stabilization likely as interest rates plateau and corporate earnings adjust to new realities.
Long-Term (5+ years): Structural shifts such as AI adoption, green energy transition, and emerging market growth will redefine equity leadership.
However, investors must prepare for a more fragmented world economy, where regional blocs, supply chain diversification, and economic nationalism alter traditional correlations.
Conclusion
The phrase “global equities under pressure” captures more than a market trend—it reflects a paradigm shift in global finance. The combined forces of inflation, monetary tightening, geopolitical instability, and technological realignment have created one of the most complex environments for investors in decades.
Yet, history shows that periods of pressure often precede renewal. As economies adjust, inflation subsides, and innovation continues, equities will likely regain their footing. For prudent investors, this period offers a chance to reassess risk tolerance, strengthen diversification, and align portfolios with the structural forces shaping the next global economic cycle.
In essence, the current equity downturn is not an endpoint but part of the continuous evolution of global capitalism—one that rewards resilience, adaptability, and long-term vision.

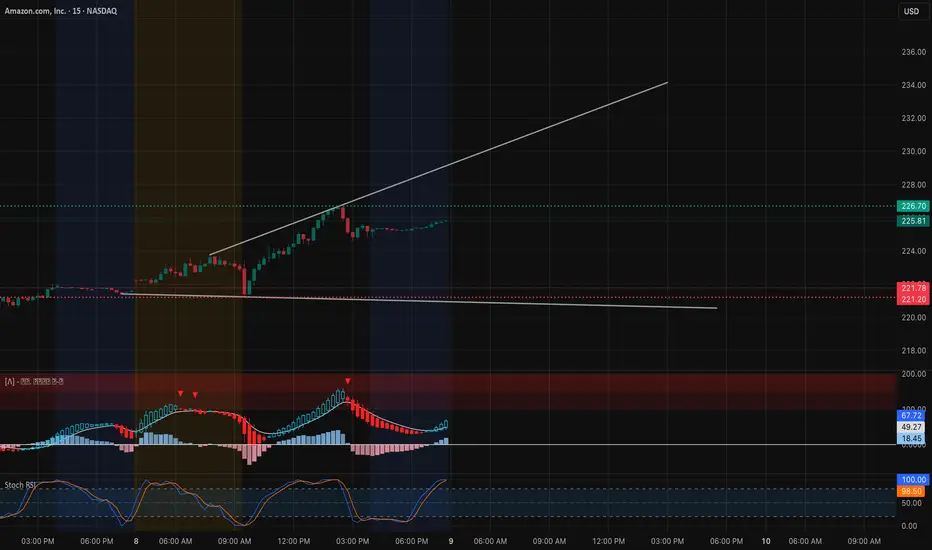
AMZN Oct. 9 — Bulls Defending Key Level, Break Toward $230Amazon (AMZN) has maintained its bullish bias, consolidating around the $225–$226 zone after a strong impulse move from $218 support. The structure remains intact with higher highs and higher lows, supported by Smart Money Concepts (SMC) signals showing BOS (Break of Structure) and CHoCH (Change of Character) confirmations along the way.
On the 15-minute chart, AMZN recently showed a minor CHoCH near $226, suggesting a short-term pullback or liquidity grab before another possible move higher. MACD shows a bullish cross forming again after a brief cooldown, and Stoch RSI is resetting from overbought territory — both pointing toward renewed upside momentum if buyers reclaim $226.7.
On the 1-hour chart, the price is holding above the key HVL ($217.5) and consolidating under a major gamma resistance zone between $227.5–$230. The volume profile supports an ascending structure with healthy accumulation near the current levels.
Support and Resistance Levels:
* Immediate Resistance: $226.70 → $227.5
* Major Resistance (Gamma Wall): $230 → $232.5
* Immediate Support: $221.78 → $220
* Key Support Zone: $217.5 → $215
GEX & Options Sentiment (1H GEX Chart):
* Highest positive Call Gamma resides around $227.5–$230, aligning with visible resistance on the chart.
* Strong Put Support zones form near $215–$217.5, creating a gamma cushion below.
* IVR is elevated at 38.7, with Calls dominating at 38.5%, reflecting a bullish bias among traders.
* The GEX curve remains strongly positive, implying dealer hedging still supports upward pressure if AMZN holds above $222.
Trade Scenarios:
Bullish Setup:
* Entry: Above $226.7 breakout
* Target 1: $230
* Target 2: $232.5
* Stop-Loss: Below $221.5
* Rationale: Maintaining higher lows with bullish GEX and MACD momentum confirms strength for a continuation run toward gamma resistance.
Bearish Setup:
* Entry: Below $221.5 breakdown
* Target 1: $217.5
* Target 2: $215
* Stop-Loss: Above $224
* Rationale: A clear CHoCH with MACD divergence could trigger a retracement into the gamma neutral zone before buyers step back in.
AMZN remains bullish-biased as long as it holds above $222, with $230–$232.5 as the next magnet zone for liquidity and potential option-driven momentum. Watch SPY correlation closely — a breakout in indices could accelerate AMZN’s next leg higher.
Disclaimer:
This analysis is for educational purposes only and does not constitute financial advice. Always do your own research and manage your risk before trading.
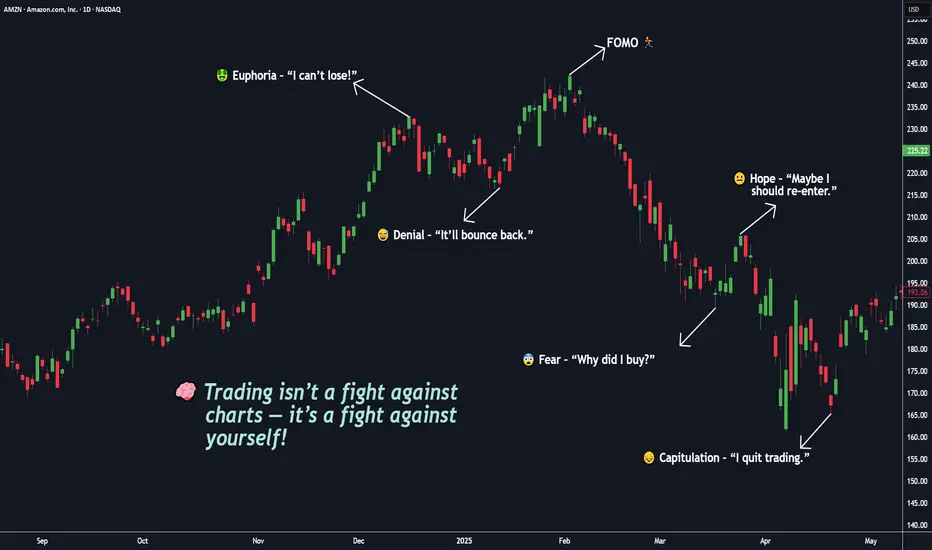
You’re Not Competing With the Market, You’re Competing With Self🧠 Trading isn’t a fight against charts — it’s a fight against yourself.
If you’ve ever told yourself “I’ll just take one more trade”, you already know this battle.
But in truth — the real battle happens inside your mind.
You start your day with discipline: BITSTAMP:BTCUSD , NASDAQ:AMZN , OANDA:XAUUSD , NASDAQ:META
📋 “ Two setups max. 1% risk. No emotions. ”
But then the market shows you something that looks perfect.
Price moves fast. Your pulse jumps. You click “BUY BUY BUY.”
Seconds later , the candle reverses — and suddenly, you chase a candle, break a rule, or move your stop just to “ give it a little more space ,” you’re not losing to the market my friend, You’re losing to your own impulses. ⚔️
You’re not trading the chart anymore — you’re trading your hope. And that’s what makes trading beautiful — it’s not a test of intelligence, it’s a mirror of your self-awareness.
That’s when the market does what it always does: it punishes emotional decisions and rewards patient ones.
💭 Emotionally! You start bargaining with yourself:
“It’ll come back.” ( When you’re greedy → it exposes it. )
“I’ll just move my stop a little.” ( When you’re fearful → it magnifies it. )
“Let me add to average out.” ( When you’re calm → it rewards it. )
The market doesn’t care if you win or lose. It simply amplifies your inner state.
You Digest it or not!, the truth most don’t want to accept:
You can’t control the market.
You can’t control news, indicators, or price spikes.
But you can control your reactions.
The moment you stop reacting and start observing — your trading transforms.
Clarity comes only when emotion leaves. 💎
⚡ Trading isn’t about predicting moves — it’s about managing yourself during those moves.
🎯 Real-Life Example:
Think back to the last time you made money on a random FOMO entry. It felt good, right?
That “instant win” wired your brain to believe impulsiveness works.
But the next time, that same instinct cost you twice as much.
That’s recency bias — one of trading’s silent killers.
Your brain craves the last emotion it felt, not the right decision.
💎 True mastery begins when you stop asking:
“Why did the market do that?”
and start asking:
“Why did I react like that?” ( 👉 “ Am I reacting, or am I responding ?” )
The market has no emotions . It’s just reflecting yours back at you — amplified, delayed, and multiplied by leverage. ⚔️
🧩 Here’s the mindset shift, that changes everything:
You don’t need to win every trade. You need to trade as if you already know yourself.
You don’t need a better indicator. You need a clearer mirror.
The edge isn’t on the screen — it’s inside your head.
When you realize that, trading becomes peaceful and You stop chasing, You start choosing.
Master that single question, and you’ll outperform 90% of traders who never will.
💬 What’s one emotion you think costs you the most trades —
👉 Fear 😨
👉 Greed 🤑
👉 Impatience ⚡
🧩 Drop it below 👇 and let’s talk about how to overcome it — build awareness together as traders, not competitors.
If this Idea gave you a value information then please, Boost it, share your thoughts in comments, and follow for more practical trading!
Happy Trading & Investing!
Team @TradeWithKeshhav
AWS REVENUE CONCERNS EASED! AMZN EARNINGS MULLIGAN! FULL PORT + NEXT 2 WEEKS OF AMAZON DRIVER WAGES INTO CALLS
26 x 285c 12/19, 5x 280c 11/21
Speculation: We melt up to 235 then pop north for ~10% on the earnings beat + rate cut with SPY 700 EOY projections (In line with GOLDMAN SACHS and WELLS FARGO )
6 of the last 8 earnings reports for AMZN have resulted in 8-12% moves within 7 days. I say, we go up this time. Last time was a perfect earning beat as expected but retail got surprised when big money reacted to AWS revenue concerns.
We broke sideways instead of recovering from the tariff drop like everything else...because of AWS. We know, NOW, it has been taken care of with the WF and GS projections of 275-280 BECAUSE of reported AWS demand....and no, that's not a coincidence. These price targets are exactly where AMZN would be if we stayed in the upward channel from 2023, IMO, and the tariff drop never happened. Essentially, right back on track with other tech companies that have completed the gap fill. (Tariff Drop and Pop) (Depicted on chart)
AMZN is also not one of the companies that have been uselessly name-dropping AI to look pretty on the QRs causing bubble concerns. Logistics speeds were reported to increase by 30% incorporating AI as most of the warehouses are ran substantially by robots in sorting and moving millions of packages daily. I suspect AMZN should weather the looming AI drop for having some tangible impact that can be measured.
At time of writing AMZN is having a 2% day, 24hrs after the new price projections sitting at 226.45 and climbing.
With this good news, + rate cuts
and market rebounding, IM ALL IN!
(Uncle Voice) One moreeee thing, were oversold on the daily chart....
AMZN 20-25%+ in 2 MONTHS

AMZN OCT 2025AMZN (4H) — Clear rejection from RES 235–244, where heavy sell-side distribution capped every bounce (25B sold marked). Price is compressing under the descending trendline while buyers keep absorbing near 210; 200 remains the next key demand, with a downside gap lurking below.
Targets:
Upside: Break/close above the trendline and 225 → 235, then 240.
Downside: Lose 210 → 205/200; continued weakness opens a gap fill toward 198–195.
#AMZN #globaltrade #investment #investing #stockmarket #wealth #realestate #markets #economy #finance #money #forex #trading #price #business #currency #blockchain #crypto #cryptocurrency #airdrop #btc #ethereum #ico #altcoin #cryptonews #Bitcoin #ipo

$AMZN massive cup and handle formingIf we look at the chart of AMZN, we can see that $236 has become an important resistance level.
So far, it's been tested multiple times which means that resistance has weakened. I do think that next time we get up to that level, it'll likely break and we can see higher prices.
On top of the resistance being weakened, there's a massive cup and handle forming on the chart. If we end up breaking resistance, the measured target would be the $313 resistance.
I've marked off other important levels on the chart should price break that key resistance level.
Let's see how it plays out over the coming month. Will likely start accumulating calls on any dips.

Breaking: AMZN Bullish Trend Near Key Breakout Levels Current Price: $219.51
Direction: LONG
Targets:
- T1 = $230.00
- T2 = $245.00
Stop Levels:
- S1 = $215.00
- S2 = $210.00
**Wisdom of Professional Traders:**
This analysis synthesizes insights from thousands of professional traders who closely monitor the unique dynamics surrounding AMZN. The stock, a bellwether in the e-commerce and cloud computing sectors, frequently acts as a sentiment indicator for broader tech-related equities. Leveraging collective intelligence from professional trading circles reduces bias and helps confirm breakout trading setups, creating actionable insights that align with high-probability patterns. Traders are increasingly focusing on AMZN’s momentum potential following its critical consolidation phase and key technical signals in recent sessions.
**Key Insights:**
Amazon's recent strategic advancements, including accelerating its AI integration within AWS, have significantly bolstered investor sentiment. The company's expanded cloud partnerships, coupled with new product launches in September 2025, create added optimism for year-end growth forecasts. The stock also enjoys strong underlying support from operational outperformance in key regions while benefiting from a steady increase in Prime user memberships.
On the technical side, AMZN has maintained its bullish trajectory above the 200-day moving average, indicating long-term strength. The stock found robust support at the psychological $210 mark earlier in Q3 and has since formed higher lows, signaling upward momentum. RSI levels are hovering near 60, leaving room for extended bullish movement without oversold conditions.
**Recent Performance:**
AMZN’s price performance in Q3 has been subtly constructive, gaining approximately 12% since July due to robust earnings reporting and resulting analyst upgrades in late September 2025. Following a short consolidation near $215 last week, the stock has resumed an upward breakout, supported by increasing trading volume. Year-to-date performance remains resilient at over 18% gains, reflecting strong investor conviction and growth expectations heading into Q4.
**Expert Analysis:**
Market professionals have identified Amazon as an ideal candidate for rotation in October. Several fund managers expect AWS revenue growth improvements from improving enterprise demand, offering potential upside surprise in Q3’s earnings call slated for November. Technical strategists are also keeping an eye on the $230 resistance level, which marks the next bullish test before a breakout window to $245. Furthermore, the recent increase in institutional buying during September signals accumulating interest among large players, bolstering near-term price confidence.
From a valuation perspective, AMZN continues to trade attractively against future growth metrics. The P/E multiple remains above average but reasonable, considering its leadership role in two dominant sectors. Improvement in margin growth could fortify its case for significant upside, particularly as operational costs stabilize into Q4 2025.
**News Impact:**
Amazon’s September announcement of enhanced AI tools and strategic partnerships within AWS has added positive momentum to the stock. This development highlights management’s focus on high-margin initiatives, which traders believe could increasingly drive earnings acceleration into 2026. Additionally, its entry into the AI-powered advertising market has raised expectations for an expanded ancillary revenue stream. Meanwhile, broader strength in consumer discretionary sectors amid Q4 holiday forecasts suggests short-term tailwinds for primary e-commerce segments.
**Trading Recommendation:**
With AMZN exhibiting bullish technical signals, strong institutional interest, and fundamental catalysts like AI integration, taking a long position with defined risk is warranted. The $215-$210 levels act as dependable support, while the broader market and sector alignment point to upward continuation. Traders should focus on the $230 level as an initial price test, where volume confirmation may justify extended upward targets toward $245. This setup offers an attractive risk-reward scenario moving into Q4 2025.
Do you want to save hours every week? Register for the free weekly update in your language!

AMAZONAMZN is almost ready to push up further to take ATH.
Disclosure: We are part of Trade Nation's Influencer program and receive a monthly fee for using their TradingView charts in our analysis.

$AMZNWith more ICE raids and major Amazon hubs in Portland under pressure, we may see a temporary slowdown in operations.
But disruption often sparks adaptation. This could accelerate Amazon’s push into automation, AI, and robotics to reduce exposure to labor risks and government intervention.
If Amazon adjusts quickly to technology, it stays ahead. If not, the pressure could weigh heavy on growth.
NASDAQ:AMZN will be a key ticker to watch.
