$AMZN DESCENDING WEDGEDescending wedge. Watching for an upwards break which is highly likely to happen. All tech should get a bounce in that event. Watching closely
AMZN trade ideas


AMZN: Moving into A Buy Zone?The Weekly Chart of AMZN shows that the stock has dropped into a strong support price level with a risk that there could be a Dark Pool Buy Zone here. The share price is now below fundamental values.
With a month before AMZN reports earnings, it will be interesting to see how the stock behaves; it will reveal how well AMZN is recovering from the hyper revenues created by the stay-at-home orders and stimulus checks of the pandemic. This is the last quarterly report that will be skewed with the revenues and earnings from the pandemic anomaly.
This company MUST provide a dividend soon.


AMZN Potential for Bearish Continuation | 3rd January 2023Looking at the H4 chart, my overall bias for AMZN is bearish due to the current price being below the Ichimoku cloud , indicating a bearish market. Looking for a sell entry at 85.88, where the previous low is. Stop loss will be at 103.78, where the recent high is. Take profit will be at 69.43, where the -27.2% Fibonacci expansion line is.
Any opinions, news, research, analyses, prices, other information, or links to third-party sites contained on this website are provided on an "as-is" basis, as general market commentary, and do not constitute investment advice. The market commentary has not been prepared in accordance with legal requirements designed to promote the independence of investment research, and it is therefore not subject to any prohibition on dealing ahead of dissemination. Although this commentary is not produced by an independent source, FXCM takes all sufficient steps to eliminate or prevent any conflicts of interest arising out of the production and dissemination of this communication. The employees of FXCM commit to acting in the clients' best interests and represent their views without misleading, deceiving, or otherwise impairing the clients' ability to make informed investment decisions. For more information about the FXCM's internal organizational and administrative arrangements for the prevention of conflicts, please refer to the Firms' Managing Conflicts Policy. Please ensure that you read and understand our Full Disclaimer and Liability provision concerning the foregoing Information, which can be accessed on the website.

MSFT can be back from the bottom of the channelhi my friends
one weekly support line and one broken channel from the bottom that caused the price to decrease one level on the channel down.
now the market has to decide, is a recession coming?
it is not an advice for buy or sell
NFA

AMZN - Update - Another retailer in trouble? This is an update to my August 8th sell publication.
A sell recommendation...Appears to be a common theme among retailers...
As you can see there was a breakdown through the white median line on October 28th.
I believe we are now in the middle of the "C" wave with a downward acceleration about to commence.
My price target is in the mid 50's area... TBD.
Weekly view here

Major BULLISH signal - (AMZN)Amazon (AMZN) offers a good buying opportunity.
Disclaimer: All content has only educational and informational purposes, and never should be used or take it as financial advice.

Dead Cat BounceFrom the current levels its very likely that we may see some buying pressure but this would be very only till the resistance zone most likely. And from there shorts will enter the trade to bring the price down. Watch out the trendline, wait for a breakout/reversal. Let the price first break 20 day MA to consider longs.
Hit like & follow guys;)

AMZN....4H= Technical analysis of AMZN on the 4-hour chart
= The price is inside a downward channel in general
= He built a wedge pattern
= There are currently four purchasing targets available


AMZN long for DCBexpecting a bounce from this level.
filled the opening gap down with a nice closing price.
TP 104. let's see.

quick amazon long spotquick weekly long here. maybe with some feb 90-80$ calls. daily squings alone could net some real nice gains.
AMZN, 8d/-26.39%falling cycle -26.39% in 8 days.
==================================================================================================================================================================
This data is analyzed by robots. Analyze historical trends based on The Adam Theory of Markets (20 moving averages/60 moving averages/120 moving averages/240 moving averages) and estimate the trend in the next 10 days. The white line is the robot's expected price, and the upper and lower horizontal line stop loss and stop profit prices have no financial basis. The results are for reference only.

$AMZN Analysis, Key levels, and Targets $AMZN Analysis, Key levels, and Targets
So I just want to be transparent about my position and it’s not a big one at all… I have 100 shares at 105… lol…
I’ve been selling puts to bring that average down with no avail, but at least I’ve been collecting premium…
This is an interesting level because we are at covid lows which seem to be holding…
I sold puts again at 82 for next week… I’d love to get shares at 82 to bring my average down to 93.5
Honestly, AMZN will stay on my list for next year… super excited to see how she trades from here…
AMZN short-term bounce.Amazon is a great company with strong fundamental, but the valuation at this point is way too high for the market.
Remember, we are in quantitative tightening ( less money supply) market. The market will punish the over valued stock.
However, I can see AMZN is going down in the channel ( not perfect, but close enough), and now its at the lower end of the channel. I expect a reasonable bounce from this level to 90+ level then get rejected. The next target for my long term position is 65 level.


AMZN Bearish Outlook Bearish Indications
* Making LL and LH since 22 Oct on 1h Time frame
* Support = 79 to 81 Resistance = 101 to 102
* Trend channel trading since 11 Nov 2022
Bullish Indications
* Trend channel trading next hard resistance = 88 and support = 79
Bias = Short
Plan
Entry @78
SL @ 86
TP @ 70

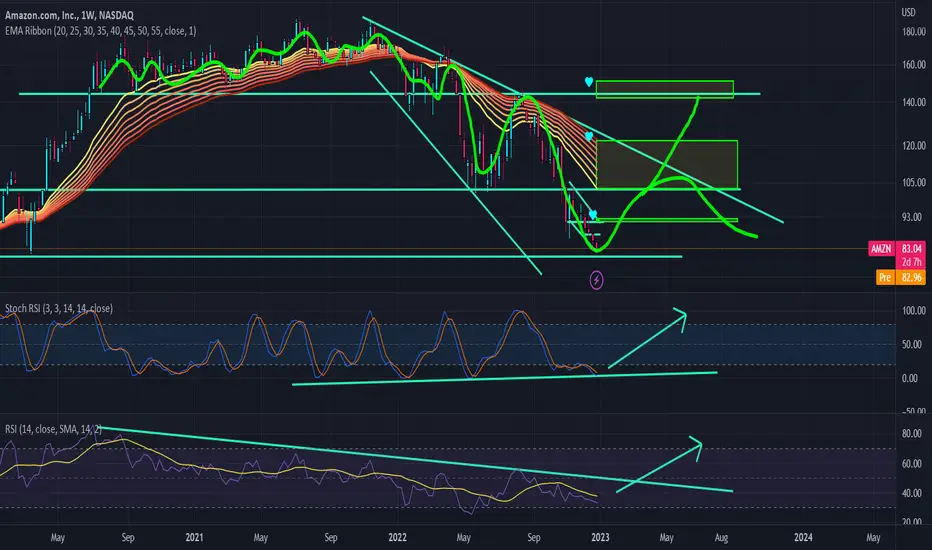
Is AMZN going sub $60!Hi guy & gals,
This is my technical analysis of the price of AMZN.
In my charting I do a top down analysis from the 12 month chart to what you see here now giving me my key levels most people don't have.
I use the trend based fib extension, fib retracement and smoothed moving averages in my chart with rectangle coloured zones. I now also use faces in my analysis to show what I think is the fear (sad face) hold (plan face) & greed (happy face) scenarios, I also include question marks and exclamation marks and may also use other symbols in the future.
What I see playing out is the stimulus that got handed out in the USA is now being drained from the markets and into the smart moneys bank accounts.
What I mean is at the end of '2019 we had the c-19 pandemic and the markets got flooded with excess capital which artificially pumped the markets, what we are seeing now is the extraction of capital and probably a big short moment on the horizon.
Using the 3 day chart we can see price took off around March '2020 with no significant pull back taking place, now that the 200 ssma has been broken I see the price falling below the red zone and to the $60 - $50 dollar area with a possible bounce to then continue falling to the orange zone or even the green zone prime buying levels in my personal opinion. The key here is we need to see the happy face holders from before '2020 to start selling their long term bags this would indicate to me that the bottom would be in for this to play out I would imagine it will take some time.
We would then be looking for a flattening in price indicating to me that the lows may have come in. I would then start to look for price to re-claim the 200 ssma for a long term trend reversal.
This is just my personal outlook on the price of AMZN and should NOT be taken as finantual advice. DYOR.
Crypto Leonard.

Short?
it's in the red channel and at support so I went short, hope it goes well
This is not a financial advice, just showing my play and reasoning.

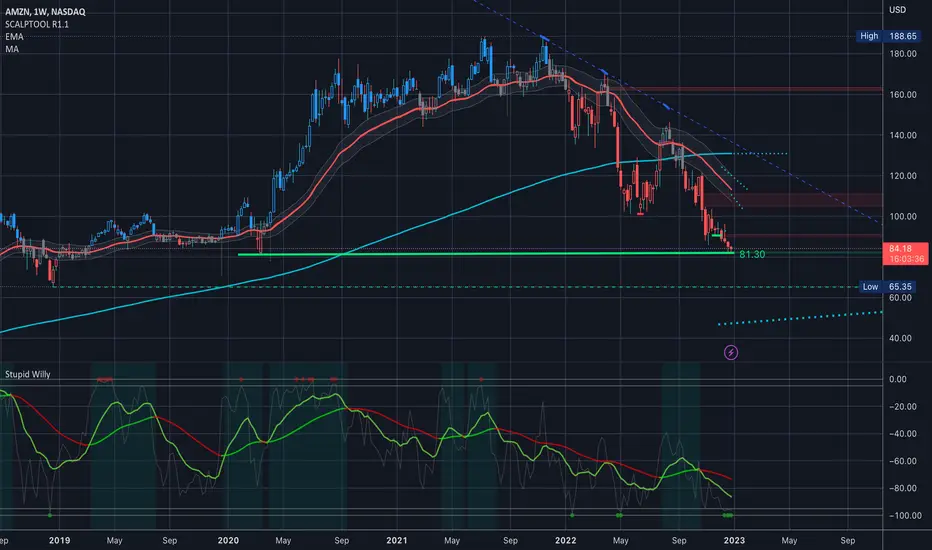
AMZN Week ChartThe rejection on AMZN at $83 looks really interesting to me. Each time we hit a major Support area with fear in the markets (show by the red bars below the candle sticks). We have pretty violent reaction the short term trend. To build enough momentum to break through $83 down to $70, I'm looking for a pull back at the levels we're at now to at least $105 (assuming we continue to respect the trendline).
Not ignoring the fact that last time were at these levels we did have a consolidation period for about 3 months give or take. I'm looking to give about 8% SL slack, just to account for the wicks. But remember we don't close unless price CLOSES below the SL.
Once we come back to test the trendline again I'm riding back down to $70.
Please feel free to DM me on here or leave a comment if you have any questions about the analysis.
And remember
BULLS MAKE MONEY
BEARS MAKE MONEY
BUT PIGS GET SLAUGHTERED!

AMZN Potential for Bearish Continuation | 27th December 2022Looking at the H4 chart, my overall bias for AMZN is bearish due to the current price being below the Ichimoku cloud , indicating a bearish market. Looking for a sell entry at 85.88, where the previous low is. Stop loss will be at 103.78, where the recent high is. Take profit will be at 69.43, where the -27.2% Fibonacci expansion line is.
Any opinions, news, research, analyses, prices, other information, or links to third-party sites contained on this website are provided on an "as-is" basis, as general market commentary, and do not constitute investment advice. The market commentary has not been prepared in accordance with legal requirements designed to promote the independence of investment research, and it is therefore not subject to any prohibition on dealing ahead of dissemination. Although this commentary is not produced by an independent source, FXCM takes all sufficient steps to eliminate or prevent any conflicts of interest arising out of the production and dissemination of this communication. The employees of FXCM commit to acting in the clients' best interests and represent their views without misleading, deceiving, or otherwise impairing the clients' ability to make informed investment decisions. For more information about the FXCM's internal organizational and administrative arrangements for the prevention of conflicts, please refer to the Firms' Managing Conflicts Policy. Please ensure that you read and understand our Full Disclaimer and Liability provision concerning the foregoing Information, which can be accessed on the website.

Amzn Going Long (TS1)Testing strategy 1 as bullish points are more than bearish, so biased as Long and executing plan A.
Backup plan, is price breaks the support at 83 then Plan B can be executed for going Short
Bullish Indications:
1- Buyers presure to bring up the price
2- Strong Support zone from 83-82 which is not broken since Apr 2021
3-upper trend line (based on line chart on 4H) is showing the the retracement will continue to upwards
4- AB=CD pattern shows that reversal is expected
Bearish Indications:
1- Bearish Trend on 1H, 4H & 1D since sept 2022
2- Next Coming Resistance at 86 & 88
3- is support is broken at 83 then we can have a long bearish ride
Plan A:
Long
Entry: 85.25
SL: 82
TP1: RRR1
TP2: RRR2
TP3: RRR3
Plan B:
Short
entry : below 83 (current Support)
SL: 86
TP1: RRR1
TP2: RRR2
TP3: RRR3
