spike upward after 3Drive patternafter bearish 3drive pattern in daily timeframe, price is seeking to reach drive 1.
the liquidity void between $104.8~$109.7 can force stock retracement to lower level.
AMZN trade ideas

A sense of debtIn the previous two posts, we explored how assets are grouped in a company's balance sheet.
Part 1: Balance sheet: taking the first steps
Part 2: Assets I prioritize
Now let's deal with Liabilities and Stockholders' equity. Let me remind you that these are the sources of funds that give a company assets. And indeed, with what funds can a company have assets? Either with its own funds (stockholders' equity), or with funds borrowed (liabilities). For simplicity, we will call them Debts and Equity.
Debts can vary in maturity, so we've divided them into two categories in the balance sheet: Current liabilities and Non-current liabilities .
Current liabilities include:
- Current debts are debts that need to be paid back within a year after they are incurred. Do you remember our master took a loan from the bank to make a large batch of boots? That loan will be recorded in this item (assuming the loan is up to one year in repayment).
- Accounts payable (debts to suppliers of goods and services). You can borrow money not only from the bank, but also from your suppliers, for example. In other words he is giving you raw materials now, but is ready to accept payment later. Such debts are reflected in this item.
- Accrued liabilities (Provisions for future expenses on unpaid bills in the form of wages, rent, taxes). The word "debt" is in many ways synonymous with the word "liability." A company may have many such liabilities: payment of wages, rent and taxes. In essence, these are also debts to be paid during the year. For convenience, cash reserves are set aside for them. They are spent at the moment when the payment is due. Such reserves are recorded in this item.
- Other current liabilities . Debts or liabilities with a maturity of up to one year that are not included in the categories above are shown here.
Non-current liabilities include:
- Long term debt - these are debts that need to be paid back more than one year after they are incurred. If our master had borrowed from the bank for two years, such a loan would fall into this category.
- Deferred taxes liabilities (Provision for taxes to be paid in a future period). Tax rates are subject to change, and new taxes may come into effect in a year or more. But even now, the company can set aside money for future taxes.
- Other long term liabilities . Here are debts or liabilities with a maturity of more than one year that are not included in the categories above.
In short, debts are loans taken by the company, provisions for tax liabilities, and debts to suppliers.
The amount of debt is a very important indicator in the fundamental analysis of a company. On the one hand, the mere presence of debt is not scary, because it demonstrates that banks trust the company and give it loans for development. On the other hand, a substantial amount of debt can cause serious problems and losses in the period of weak sales of goods or services. Banks are unlikely to suspend interest charges on loans if a company is doing poorly. This means the company will incur expenses in the form of interest on loans that are not offset by revenue. Also a reminder that if a company goes bankrupt, the owners of the stock get the assets of that company only after all debts have been settled . If the debts are so large that they exceed the value of all the property, the shareholders get nothing. For these reasons, I select companies with small debt loads.
What liabilities do I focus on?
- Current debt;
- Accounts payable;
- Long term debt.
For me, these are the items that most clearly reflect the company's debt situation.
In the next post, we will conclude our study of the balance sheet and look at the basic source of assets, which is Equity. See you soon!

AMZN 1DHello ladies and gentlemen according to my graphical analysis of AMZN 1D , i recommend for the moment to keep AMZN stock in your portfolio because there is a great probability of reaching 120 $ in the next few weeks

Amzn Dark cloud cover Closed up at 2 resistance points and was the main reason for the drag on XLY sector. Closed up with a dark cloud cover pattern which indicates a reversal pattern. Tomorrow will confirm or negate this pattern.
If amazon does a bearish reversal then 86$ gap close is my target.
If amazon breaks over resistance then my bullish target would be 105 gap resistance .
The bigger picture though is a falling wedge, which is a bullish pattern but we could head for one more leg down before the move out

AMZN D1 - Reversing at confluence levelAMZN D1: BEOB at confluence of ML, TL and 1:1. Watch for potential entry setups on LTFs

AMZN LongWeekly RSI divergence
Demand Zone created 3/12/2020 -- 3/16/2020
Earning 10/27/2022 Gap and run, to demand zone.
Entry 89
Stop 80
Target 104, 130
Risk management is much more important than a good entry point.
I am not a PRO trader.
In my trading plan, the Max Risk of each short term trade should be less than 1% of an account.

"amzn" has established a support for a bottomAfter a 44% move down, amzn has established its first support at 84.41. As long as this hold, it can now go up.

AMZN at a nice buy spot Nice long-term level. Pretty double bottom. R:R is good! CPI is this Thursday. I'm sure that will impact AMZN. But even if someone is picking up small size here, it makes sense. :)

AMZN time for recoverAMZN breaks above the structure last week. I expect a bullish move, target the red zone above.

AMZN Monthly P&FThere is a support zone going all the way back to 2014 on AMZN. Most of the bad news has been baked in (layoffs, etc). Although, I am a little concerned with declining margins, this would be a good area for some bottom fishing.... Earnings soon.

AMZN WEEKLYRULES:
-If price break Point 2, 4, 6, or 8 cancel the setup
-Price needs to break Point 1, 3, 5, or 7 to confirm the setup
When price reach the 100FE(BLUE BOX) it normally does a pullback/retest or reversal
The market can Truncate(fall short)

Waiting for the next results!-The AMZN asset did what was expected according to the previous analysis. See by clicking here .
-Will the rest of the process that is to get the region of $78.50 be completed?
-We have results to be reported soon, and if they come back bad, we can have the test in the region indicated above.
-Let's wait for the next candles and results.
-Do your analysis and good business.
-Be Aware, If You Buy, Use Stop!
-See below for other reviews.

AMAZON Resistance Ahead! Sell!
Hello,Traders!
AMAZON is trading in a downtrend
But the pair has recently went up
To retest the horizontal resistance
From where a bearish
Continuation is likely
Sell!
Like, comment and subscribe to boost your trading!
See other ideas below too!

AMZN daily at resistanceAMZN daily - is at major resistance. Actually, it breaks out of a falling wedge which is bullish. Volume is increasing which is also bullish. Moves out of the pattern would be strong and fast.
However, RSI is close to overbought territory.
MACD is moving up strongly, histogram tick is moving strongly while the MACD line is already above zero line while the signal line is catching it, which indicates a strong momentum of price movement.
Overall: AMZN daily is at resistance with RSI close to the overbought territory which could be indicated a small correction. Would be great for a further move if AMZN creates some kind of high base at and around these levels and then explode to the upside because at this moment it is a little bit away from 8 days MA so it needs to cool down to have health up momentum. Very very strong resistance in the up move would be BigRed or 200 days MA and blue falling trend line.
On another side, if AMZN got a strong rejection in the next one or two trading days, it would be pretty bearish. The first support would be 50 (blue) and 20 (green) days MA and if not hold then a major low from a few weeks ago where AMZN would bounce for sure.

Amazon to the stone age! What else is there to say?
Amazon is being cast back to whence it came!
20$ to 40$ is likely but true support is at 5.62$
IMO Amazon is in trouble and further decline is expected!

BTC ; WORSssst case scenario ; weird amazon destruction fractal BTC ; WORSssst case scenario ; weird amazon destruction fractal
pretty bloody self explanatory
thought id throw this up after seeing victor cobra touch on it in his vid. interestingly disgusting fractal. hopefully its wrong lol

AMZN LONG We have just pass the down trend line with boost ,
after a small retest there is possibility to ride till 120

AMZN Flag Pattern 65mAMZN Flag Pattern 65m// ATR: 3.67, Beta: 1.17, RVOL 0.95// Bias: Risk on// Basic illustration/study for learning :)

ABCD Harmonic Pattern on AmazonNASDAQ:AMZN
Bullish ABCD Harmonic Pattern on Amazon in current move, implying bullish move.
2 bullish candles formed recently may extend its rally towards 106 at 38.2% fib level.

AMZN LongI am bullish on AMZN.
My trade levels:
Entry price: $95.51
Take profit: $109.31
Stop loss: $90.55
Risk/reward: 2.78

Amazon - finding support hereAmazon is finding some major support here. Look for a short term bounce this area.


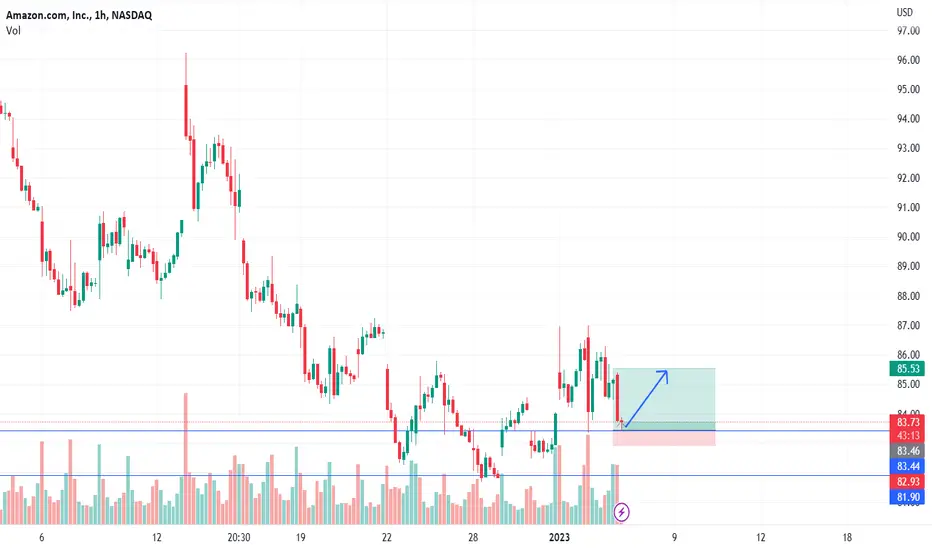
Smart and fast trade on amazonAmazon reached a support area where there will be a strong buyer
Entry is done by putting a stoploss as shown in the graph .
For further more wait for our updates .