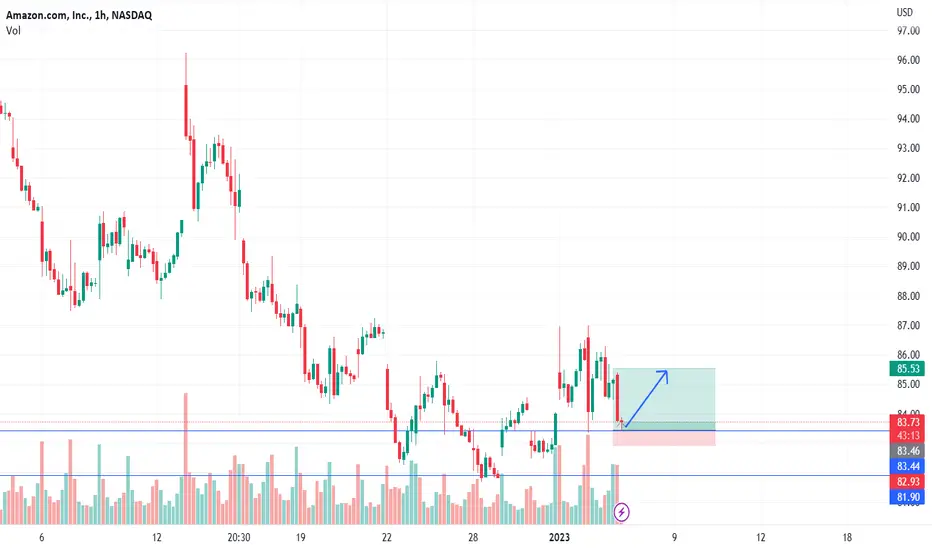
Smart and fast trade on amazonAmazon reached a support area where there will be a strong buyer
Entry is done by putting a stoploss as shown in the graph .
For further more wait for our updates .
AMZN trade ideas
SPY & AMZN ICT Trading 1/12/23Just another Daily Recap in the books. Today went well, saw 2 greats setups and capitalized on both. Both were implementing ICT Mentorship 2022 concepts with the Power of 3, and our OTE when it comes to trading.

AMAZON WITH ITS EXPANDING CHANNEL AND BULLISH BREAKOUT📈The following expending channel confirms a bullish breakout and here we can expect the price to do a bullish reversal with the confirmation spotted where we may revisit the levels close to 120 one more time.
Thanks for visiting my tradingview profile. Hope the chart update helps you out. If you like the content do hit the thumbs up and follow me for future updates. 🙌🏻😎
📌For more details regarding this chart update, please message me on tradingview chat. Thank you!


AMZN LONG expectation Instrument: AMZN
Optimum technical indicator: OBV EMA 20
Current signal: LONG
Technical indicator win-rate: 47%
Days for backtesting: 2220
Timeframe for testing: 1D
Forecast day price: 89,8700
Enter point: 90,000
Take-profit: 94,000
Current stop-loss: 86,6913
Multiple for stop-loss strategy ATR(14): 1,1
Average trades per month with optimum technical indicator: 3
Average time for 1 trade with optimum technical indicator: 7
Average profit per 1 trade: 1,76%
Projected annual return w/o leverage: 30,2%
Technical analysis applicability for 3325 technical strategies: 97%
Technical analysis recommendations:
Long: 36%
Short: 59%
Neutral: 5%
Stable long-term profit for FOREX, CRYPTO, Equity based on backtesting optimization algorithm. Instant analysis of 3.2K technical strategies

AMZN - Open Short Put $75 (Jan 27 `23) *High IV enviroment
*neutral bias
*two resistence levels $86 and $81
*Credit ($1,06) and 42 "DTE"

Levels to watchThis move has the potential to get to $100, but i'd be selling as price starts to close in on that area. I expect the $75 level to be tested within the next 3-6 months.

amazon stock reversal from weekly support levelIn my opinion amazon's reversal is confirmed as the stock has bounced from the weekly support level as well as I see a clear trend break on the RSI level as well.
:: Please NOTE:: This is not investment advice, I am at an early stage of learning technical analysis. Please comment on what you think about my opinion

Amazon Analysis 10.01.2023Hello Traders,
welcome to this free and educational analysis.
I am going to explain where I think this asset is going to go over the next few days and weeks and where I would look for trading opportunities.
If you have any questions or suggestions which asset I should analyse tomorrow, please leave a comment below.
I will personally reply to every single comment!
If you enjoyed this analysis, I would definitely appreciate it, if you smash that like button and maybe consider following my channel.
Thank you for watching and I will see you tomorrow!

amazon forecat with target with stop lossamazon inc next year .
we must take care of the stoploss indicated in the chart .

Channel Down //Economic Reports This WeekPrice is at the resistance trendline of the channel.
2 M structures noted, a very large one (orange) and a small one (white). The small one measures to be a Butterfly. The 2nd leg hit the .786 and the 4th leg hit the 1.272.
Price remains above the .618 of the trend up since the Covid low. Price is below the 50% level.
No recommendation.
Mr. Market is choppy today and feels as if it is in wait mode due to upcoming economic reports.
THURSDAY, JAN. 12
7:30 am Philadelphia Fed President Patrick Harker speaks
8 am St. Louis Fed President James Bullard speaks
8:30 am Consumer price index Dec. -0.1% 0.1%
8:30 am Core CPI Dec. 0.3% 0.2%
8:30 am CPI (year-over-year) Dec. 6.5% 7.1%
8:30 am Core CPI (year-over-year) Dec. 5.7% 6.0%
8:30 am CPI excluding shelter (3-month SAAR) Dec. -- 1.3%
8:30 am Initial jobless claims Jan. 7 210,000 204,000
8:30 am Continuing jobless claims Dec. 31 -- 1.69 million
2 pm Federal budget Dec. -$69 billion -$21 billion
FRIDAY, JAN. 13
8:30 am Import price index Dec. -0.8% -0.6%
10 am UMich consumer sentiment index (early) Jan. 60.7 59.7
10 am UMich 1-year consumer inflation expectations Jan. -- 4.4%
10 am UMich 5-year consumer inflation expectations Jan. -- 2.9%

Multi-Month long idea on AmazonAmazon has been beaten down hard this year and I think its time to start scaling in long. Multiple factors are coming into play here as we approach the white line. I plan to start a 1/4th of a total long term position at the white line. As the chart develops and amazon makes its moves, I will update this post as to where I am adding to this long position (if I add).

Amazon Set Up To Target $60In this update we review the recent price action in Amazon and identify the next high probability trading opportunity and price objective to target

amazon 2023 planamazon 2023 plan
1. expect to dip buying
2. have to more down to buying area
3. tight stop loss

AMAZON - Strong Again! 📦Hello TradingView Family / Fellow Traders. This is Richard, as known as theSignalyst.
on WEEKLY: Left Chart
AMZN is sitting around a strong support in green 80.0. For the bulls to take over long-term, we need a break above the blue zone AND upper blue trendline.
Meanwhile, since we are around a support zone, we will be looking for buy setups on lower timeframes.
🏹on H4: Right Chart
For the bulls to take over, we need a break above the red channel and previous major high in red.
Meanwhile, until the buy is activated, AMZN can still trade lower inside the weekly support.
📚 Always follow your trading plan regarding entry, risk management, and trade management.
Good luck!
All Strategies Are Good; If Managed Properly!
~Rich

AMZN - may have come into supportAMZN came into a potentially strong support zone 79 - 84 comprising of a horizontal support area as well as the 88.6% fibonacci retracement of the major covid upswing AB. Some bullish divergence is now seen on it's weekly chart hence there is a good chance that this support of 79 will hold in the near term. However, any bounce from here must still be viewed as short term until we can see that a bottom is clearly in place (usually on hind-sight!).
A safer region to consider going long is when it could at least clear near term resistence (101 - 105). Until then.
Disclaimer: Just my 2 cents and not a trade advice. Kindly do your own due diligence and trade according to your own risk tolerance and don't forget that money management is important! Take care and Good Luck!

AMZN Potential for Bearish Continuation | 9th January 2022Looking at the H4 chart, my overall bias for AMZN is bearish due to the current price being below the Ichimoku cloud, indicating a bearish market. Looking for a sell entry at 85.88, where the previous swing low is. Stop loss will be at 103.78, slightly above where the 23.6% Fibonacci line is. Take profit will be at 69.43, where the -27.2% Fibonacci expansion line is.
Any opinions, news, research, analyses, prices, other information, or links to third-party sites contained on this website are provided on an "as-is" basis, as general market commentary, and do not constitute investment advice. The market commentary has not been prepared in accordance with legal requirements designed to promote the independence of investment research, and it is therefore not subject to any prohibition on dealing ahead of dissemination. Although this commentary is not produced by an independent source, FXCM takes all sufficient steps to eliminate or prevent any conflicts of interest arising out of the production and dissemination of this communication. The employees of FXCM commit to acting in the clients' best interests and represent their views without misleading, deceiving, or otherwise impairing the clients' ability to make informed investment decisions. For more information about the FXCM's internal organizational and administrative arrangements for the prevention of conflicts, please refer to the Firms' Managing Conflicts Policy. Please ensure that you read and understand our Full Disclaimer and Liability provision concerning the foregoing Information, which can be accessed on the website.

Basics : Amazon Daily Timeframe NASDAQ:AMZN
Applied Dow Theory, LHs & LLs
Staring from Aug22, NASDAQ:AMZN made a high of 146.58, since then continuously making
lower highs and lower lows till 81.7

Amazon at Major Support levelAmazon is resting at major support level. Next one or two weeks will define the course of Amazon.

Amazon Either OrLooking at potential long and shorts for Amazon, Long from just above 80 and short from just below 100

January Gainers (AMZN, account up 0.5%)1st gainer in January is AMZN. Holding period is 6 days (12/28/22-1/3/23). Account up 0.5%.
This month till today, my account is up 0.5%, average holding period is 6 days.
My trading method is mostly short term and is independent of market swings.
Will keep updating on my trades.

$AMZN LongPrice at apex of huge falling wedge and major support level from March '20.
Confirmed bullish divergence on daily with developing bullish divergence on weekly chart.
5.5 R:R. Tight stop loss below recent lows.

Amazon short-termAmazon Target on short terms :
Support :79-81
Target 1 :86-87
Target 2: 92-93
not financial advice.
