Sideways and almost ready.Price consolidated sideways for a few days, and it wants to break higher to retest previous highs.
CORT trade ideas


LONG CORTIf the market pulls back, this will too. But we are at a level of support, so low volatility entry will allow us to manage the risk on this trade better. Breaking that support, we would close the trade.

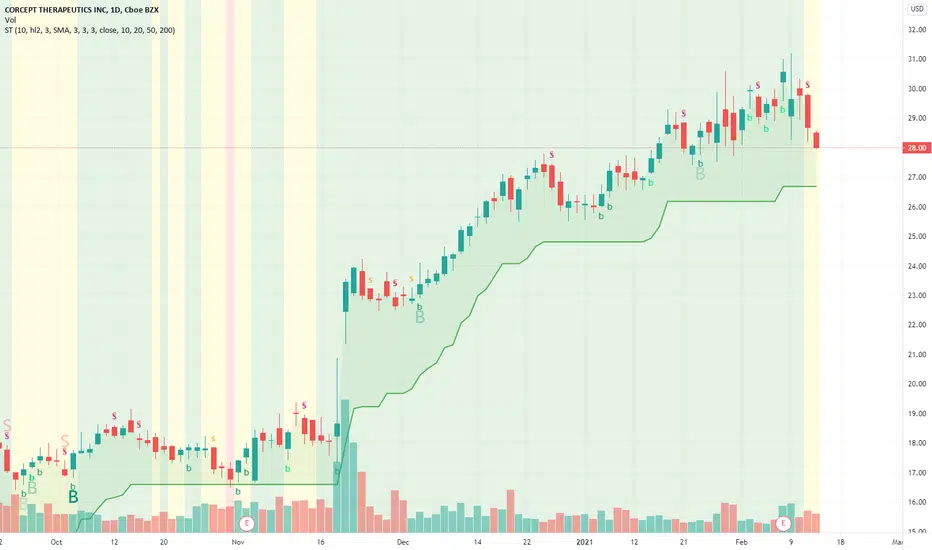
CORT, MACD Histogram just turned positiveThis is a Bullish indicator signaling CORT's price could rise from here. Traders may explore going long the stock or buying call options. Tickeron's A.I. dvisor identified 48 similar cases where CORT's MACD histogram became positive, and 42 of them led to successful outcomes. Odds of Success: 88%. Current price $30.80 is above $27.05 the highest support line found by Tickeron A.I. Throughout the month of 01/06/21 - 02/08/21, the price experienced a +16% Uptrend. During the week of 02/01/21 - 02/08/21, the stock enjoyed a +4% Uptrend growth.
Bullish Trend Analysis
The Momentum Indicator moved above the 0 level on January 12, 2021. You may want to consider a long position or call options on CORT as a result. Tickeron A.I. detected that in 61 of 75 past instances where the momentum indicator moved above 0, the stock continued to climb. The odds of a continued upward trend are 81%.
CORT moved above its 50-day Moving Average on November 02, 2020 date and that indicates a change from a downward trend to an upward trend.
The 10-day Moving Average for CORT crossed bullishly above the 50-day moving average on November 12, 2020. This indicates that the trend has shifted higher and could be considered a buy signal. Tickeron A.I. detected that in 12 of 14 past instances when the 10-day crossed above the 50-day, the stock continued to move higher over the following month. The odds of a continued upward trend are 86%.
Following a +5.91% 3-day Advance, the price is estimated to grow further. Considering data from situations where CORT advanced for three days, in 291 of 346 cases, the price rose further within the following month. The odds of a continued upward trend are 84%.
The Aroon Indicator entered an Uptrend today. Tickeron A.I. detected that in 221 of 260 cases where CORT Aroon's Indicator entered an Uptrend, the price rose further within the following month. The odds of a continued Uptrend are 85%.

U.S. Patent Trial and Appeals Board Affirms ValidityU.S. Patent Trial and Appeals Board Affirms Validity of All Claims of Corcept’s U.S. Patent No.10,195,214
announced today that the Patent Trial and Appeal Board (PTAB) of the U.S. Patent and Trademark Office has issued a decision upholding the validity of all claims of U.S. Patent No. 10,195,214, “Concomitant Administration of Glucocorticoid Receptor Modulators and CYP3A Inhibitors” (the “‘214 patent”). The ‘214 patent expires in 2037.
finance.yahoo.com

CORT Potential Long: fundamentals and shortOnly an idea.
Industry ranked 37 in biotech. 3b market cap.
Big buy happened.
Current ratio of debt coverage is 10. :)
Modest growth 6% of ROE Q/Q: :| compared to others
Current volume trend is above normal, but 20day volume is below. so wait to see.
The dip is coming and then a run up.
Double bottom in RSI is bullish.

PAY to CORCEPT THERAPEUTICS DailyHey traders, CORCEPT THERAPEUTICS is in a fake bearish move with low sell volume executed and a water carrier with strong shadow of buyers. In the TIMEFRAME M1 we can see a mini marubozu bull with a low purchase volume. Strong potential for breakout the price of going on its last precedent higher after. See if the buyers want to breakout the volume to get over the top of the pre-session. For the moment not enough power to test the intermediate median of ANDREWS PITCHFORK which corresponds to the top of the top (View on MULTI TIMEFRAME DAILY H4 and H1).
Please LIKE & FOLLOW, thank you!

CORT, Aroon Indicator entered an Uptrend on Oct 23, 2020.Over the last three days, Tickeron A.I.dvisor has detected that CORT's AroonUp green line (see chart) is above 70, while the AroonDown red line is below 30. When the green line goes above 70 while the red line stays below 30, this is an indicator that the stock could be poised for a strong Uptrend. For traders, this could mean going long the stock or exploring call options in the next month. Tickeron A.I.dvisor backtested this indicator and found 262 similar cases, 223 of which were successful. Based on this data, the odds of success are 85%. Current price $17.78 crossed the resistance line at $17.81 and is trading between $17.81 resistance and $17.32 resistance lines. Throughout the month of 09/23/20 - 10/23/20, the price experienced a +5% Uptrend, while the week of 10/16/20 - 10/23/20 shows a -0.83% Downtrend.
Bullish Trend Analysis
The Stochastic Indicator shows that the ticker has stayed in the oversold zone for 3 days. The price of this ticker is presumed to bounce back soon, since the longer the ticker stays in the oversold zone, the more promptly an upward trend is expected.
CORT moved above its 50-day Moving Average on September 02, 2020 date and that indicates a change from a downward trend to an upward trend.
The 10-day Moving Average for CORT crossed bullishly above the 50-day moving average on September 09, 2020. This indicates that the trend has shifted higher and could be considered a buy signal. Tickeron A.I. detected that in 11 of 13 past instances when the 10-day crossed above the 50-day, the stock continued to move higher over the following month. The odds of a continued upward trend are 85%.
Following a +2.35% 3-day Advance, the price is estimated to grow further. Considering data from situations where CORT advanced for three days, in 279 of 334 cases, the price rose further within the following month. The odds of a continued upward trend are 84%.

Some penny stock porn on #CORT $CORT Pennant pattern . Some penny stock porn on #CORT $CORT Pennant pattern .

Patent for KorlymGains occurring during an ongoing court hearing regarding the validity of its patent for Korlym, according to a Bloomberg headline. Corcept has been in a battle with Teva for its patent for Korlym, a treatment for Cushing’s syndrome approved by the FDA in 2012.

Corcept Therapeutics, Inc CORT - swing trading ideaThe fundamentals
While a stock’s fundamentals are not of great importance in swing trading, it’s good we consider a little of it to get an overview of the situation in the company at the moment.
The company’s fundamentals are not doing poorly at the moment. With 115.558 million shares outstanding and trading at $18.96, the market capitalization is about $2.195 billion. The basic earnings per share (TTM) is $0.9970 per share, while the price per earnings ratio stands at 19.0 (not extremely overvalued).
The second-quarter earnings report released by the company last month showed that the revenue for the second quarter was $88.6 million, which was a 23% increase from a similar period in 2019 but about $4.7 million less than the first-quarter revenue — a situation the company attributed to huge preorders in anticipation of the lockdown. Also, there is some news in July about their medication in Phase 3 Clinical Trial.
Technical analysis
Now to the technicals, which is the main thing we are concerned about. Preliminary analysis shows that the stock just broke the former 52-week high at 18.52 to make a new 52-week high at 23.48. Not only that, but it is also now trading above the 200-day moving average after falling below the average on the 11th of August 2020. Let’s take a look at the price chart and the volume bars below:
September 3, 2020
On this chart, you can see the price action from September 2019 to September 2020. Notice that the price fell from the November 2019 high at 17.69 to a March 2020 low of 9.68, which coincides with the Covid-19 pandemic-induced bear market. It recovered, like many other stocks during this pandemic, and broke the resistance at 17.69, reaching a 52-week high at 18.52 in late June 2020 but couldn’t hold on to the new grounds. It was forced to make a pullback to around 12.20 before making another resurgence to the upside, breaking above the 52-week high at 18.52.
If you look properly, you would notice that the breakout occurred with a single, tall candlestick that engulfs all the price action in the pullback preceding it, and expectedly, the price was sharply rejected at higher levels probably due to profit-taking. But the bullish pressure is because the price is supported above the previous high.
Notice that the area between the November 2019 swing high (indicated with a pink line) and the late June 2020 high (indicated with a blue line) is acting as a support zone, so, as long as the price doesn’t fall significantly below that zone, the upward potential is still valid. Also, take note of the price swings. The swing low prior to the tall bullish candlestick was a higher low when compared to the one before it — as indicated by the dark-red trend line. The long-term trend line is also sloping upwards. So, there’s an overall uptrend.
Another supporting factor is the volume. As you can see from the chart below, the breakout occurred with a huge volume, which indicates that there is a significant market activity in the stock.
Now, coming to the indicators, you can see the 200-day moving average and the 50-day moving average, with the latter staying above the former. Notice that the 200-day moving average is slightly sloping upwards, confirming an uptrend, even though the price went below it during the pullback. So, the price climbing above it is an indication of the resumption of the uptrend.
Next, take a look at the MACD indicator; you will notice that the MACD line has climbed above the signal line, and the bars are above the zero line and increasing. The stochastic has also emerged from the oversold region and is climbing up. Both of these are indications of a possible bullish setup, especially in the setting of an uptrend.


CORT LONGCORT BEAT EARNINGS Has Strong Buy Signal and Some analysts think it will hit $16
Corcept Therapeutics, Inc. is a commercial-stage pharmaceutical company, which engages in the discovery, development and commercialization of medications to treat severe metabolic, oncologic and psychiatric disorders. It focuses on the development of drugs for disorders that are associated with a steroid hormone called cortisol. Its products include korlym and korlym support. The company was founded by David B. Singer and Joseph K. Belanoff on May 13, 1998 and is headquartered in Menlo Park, CA.


Continued sell off in this tight wedgeBy no means has the sell off stopped; in the next few days, there should be another big drop;
if we manage a move outside the blue resistance (top), then we will begin a new structure; however, it is likely that we will bounce straight down from it

CORT - good fundamentals with insider tradingCORT has very good ROA, ROE, ROI, P/E, no loans and the insiders purchased stock

Corcept breakoutYou certainly should keep an eye on this when trading resumes Monday, the pattern is an indicator for a good move up. Although the breakout looks very good the volume hasn't increased at all which is a concern of course. But it looks good enough that although I'm not an accountant I checked out the 10-K; I think the company is in the black and they have potentially very profitable drugs "in the pipeline" so this should be a winner. Anyway, they hooked me, it seems to be a good bet so I've bought some shares.

CORT Head and shouldersCORT Head and shoulders still looking for support possibly down to the 12.60-11.80s level. Been a bloodbath.

Breakout over 6M base1. Breakout over 6-Month base
2. Lack of over-average volume which signifies lack of interst. It may go down.
3. Watch out price action on lower timeframes to spot optimal entry point

The weekly is back in lower portion of parallel channelRSI slowing starting to rise. Should have plenty of upside
