EXAS trade ideas


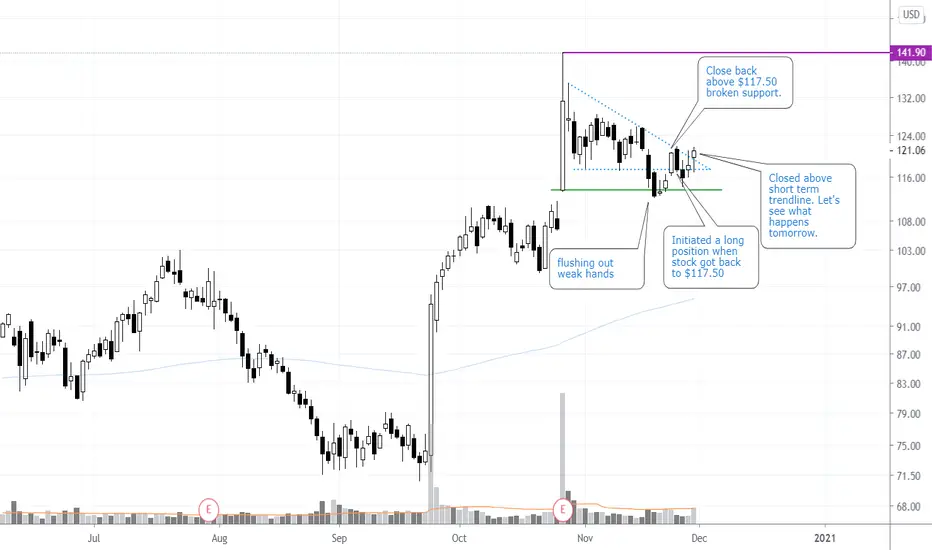
$EXAS Interesting Gap PlayExact Sciences been on my watchlist since its earning gap on 10/27 when I finally initiated a long position @ $117.50 on 11/24. Trade setup is annotated on the chart. More of an educational post around how to trade gaps. Other gaps I recently traded includes $BAC, $SNAP and $LASR (might post educational posts around how the setups played out on these).


$EXAS can rise in the next daysContextual immersion trading strategy idea.
Exact Sciences Corporation provides cancer screening and diagnostic test products in the United States and internationally.
The share price rose after the CEO had presented new research about the company's preliminary liquid biopsy data.
The demand for shares of the company still looks higher than the supply.
These and other conditions can cause a rise in the share price in the next days.
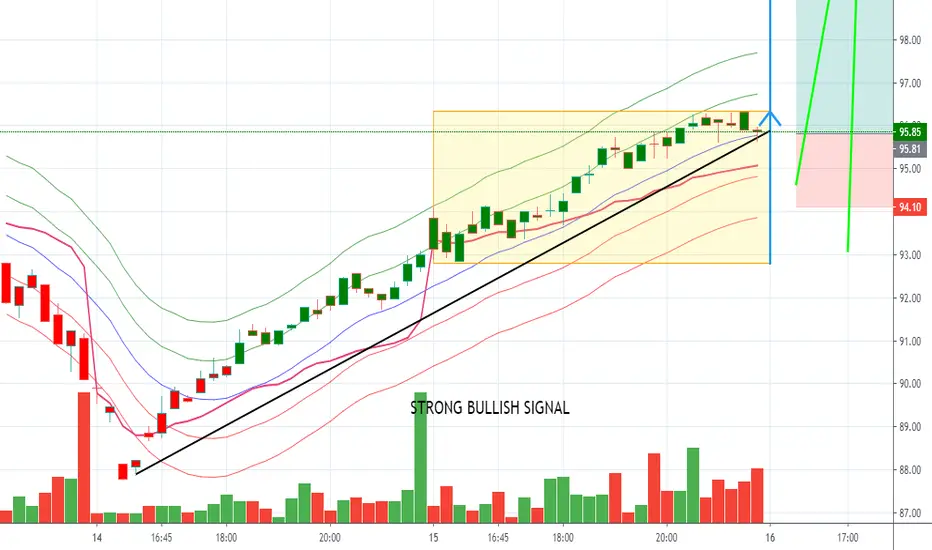
So I opened a long position from $97,69;
stop-loss — $88,88.
Information about take-profits will be later.
Do not view this idea as a recommendation for trading or investing. It is published only to introduce my own vision.
Always do your own analysis before making deals. When you use any materials, do not rely on blind trust.
You should remember that isolated deals do not give systematic profit, so trade/invest using a developed strategy.
If you like my content, you can subscribe to the news and receive my fresh ideas.
Thanks for being with me!


EXAS Long set up EXAS was very strong and up over 20%. I am looking for it to retrace a bit to buy some.. Looks good if one is looking for something in health care science and research for your portfolio or you could simply swing trade. Please do not buy or sell any financial instrument or any other assets reading this post. This is strictly for education purposes only.


EXAS: Continuation of uptrendNASDAQ:EXAS shows potential continuation of uptrend to the next resistance $119.36

EXACT SCIENCES CORP ANALYSISHey traders, EXACT SCIENCES CORP is on a bullish slant in one equilibrium zone, great possibility to breakout this zone to land in another. It is located in the previous gap so we can still breakout to find the first high point of it.
Please LIKE & FOLLOW, thank you!
Just a bunch of linesA beginners attempt here. Just curious to see where people think this is going (as a novice looking for some input).


EXAS daily 40% gains(STOCKS)before we kick start the update. your upvotes/subs are appreciated.
Why get subbed to to me on Tradingview?
-15+ years real live trading experience
-TOP Author on TradingView
-professional chart break downs
-key levels
-no junk on my charts
-frequent updates
-covering FX/crypto/US stocks
-24/7 uptime so constant updates
So without further due. Keep it short/simple and to the point.
EXAS daily 40% gains(STOCKS)
Gap fill play + strong seasonality April/May.
40% upside from here.
good luck traders!
get subbed to stay tuned for all the latest updates.
also add likes to support my efforts, thank you.


EXAS - getting into my buy rangeI'd say low to mid $80s is a buy. Horizontal support meets up with the long term trend line. They just did a $850 million convertible note offering and Mr Market is giving us a 9% discount today.

Exact Sciences Gap fill trade
Possible entry level $100
Upside target $103.63
Average analysts price target $123 - Buy rating
EXACT Sciences Corp. is a molecular diagnostics company, which focuses on the early detection and prevention of colorectal cancer. It developed Cologuard, a screening test for the early detection of colorectal cancer and pre-cancer. The company was founded on February 10, 1995 and is headquartered in Madison, WI.

EXAS - Bullish ModePrice created a nice inverted head and shoulders pattern aiming for the recent highs
as long as price is above 100$ it's very bullish
very nice upside potential here

Long-Term Buy opportunityChart and trend analysis:
Monthly timeframe - up
Weekly timeframe - up
Daily timeframe - up
Hourly timeframe - side
Trade action:
Long-term opportunity - BUY
Short-term opportunity - SELL
Important points:
1] Both, buy or sell zones have 2 price levels, color-coded for your understanding: Green (enter a trade), Red (exit the trade or stop-loss)
2] Your choice of buying or selling depends on your timeframe (long term wealth investor vs. short term income trader).
3] Follow our T4 strategy when the price reaches the zone: wait for a bullish and bearish reversal in buy and sell zones respectively.
4] Risk management strategies are critical in any trading or investing activity such as position size (how much to invest) or stop-loss (knowing when to exit with an acceptable, predefined, minimal loss).
Visit us to learn more: www.usstockadvisor.com
