Nasdaq 1 Hour Time Frame Chart AnalysisThe Nasdaq chart has formed a bearish engulfing pattern in a 1-hour time frame.
Trade ideas

Dont be greedy on IXICAs I posted IXIC price movement speculation a year ago or so, now I want to warn you this is only one of the possibilities. As we kno the price movement can choose only between two dirrefent directions. Either up or down. But now it looks too good to be true to me. But this time is different. With all the world situation and economic war between US and most of the worlds countries, media propaganda about big bear in front of our economy, europe automobile industry "cold". This is all the signt, that tells us be cautious. Be prepared to go at least "half-in" if the price starts to form higher lows on weekly chart. I Will give you updates about my movements and taught, what I think about this crap. See you down here eventually,
Wish you luck,
DonLobster

Here's Why You Should Think Twice Before Selling TechThis is a 2-month chart of the Nasdaq US Composite Index (IXIC).
At the bottom is the Stochastic RSI which oscillates up and down depending on how overbought or oversold the market is.
There have only been a few times since its inception a half-century ago, that the Nasdaq Composite Index had a 2-month chart this overextended to the downside. The K value of the Stochastic RSI has actually reached zero.
If the 2-month chart closes at that level, it will mark a super rare occurrence that has only occurred twice in the history of the Nasdaq (the last time being at the bottom of the Great Recession).
I calculated the one-year returns for the Nasdaq one year (from low to high) after the K value of the Stoch RSI on the 2-month time frame dropped below the oversold line (to or nearly to 10). For the case of the Dotcom bust and the Great Recession, I selected the point when the Stoch RSI's K value first reached 0, which is its current reading and which is thus fairly comparable. Even during these significant economic downturns, buying at this oversold level produced decent returns one year out.
Obviously, past price action does not guarantee future price action, but history does tend to repeat itself. Odds are that ten years from now you'll probably be wishing you had bought into this oversold level.
Here are the one-year returns from the market bottom during the 2M period (when the Stoch RSI K value met the criteria listed above) to the market top of the 2M period one year later:
+95.78%
+36.47%
+31.24%
+78.89%
+20.17%
+69.50%
+27.14%
+52.36%
Mean: +51.44%
Not financial advice. As always anything can happen.

are we rekt? I hold nowhere near enough knowledge to make a call like this but they do look pretty similar.

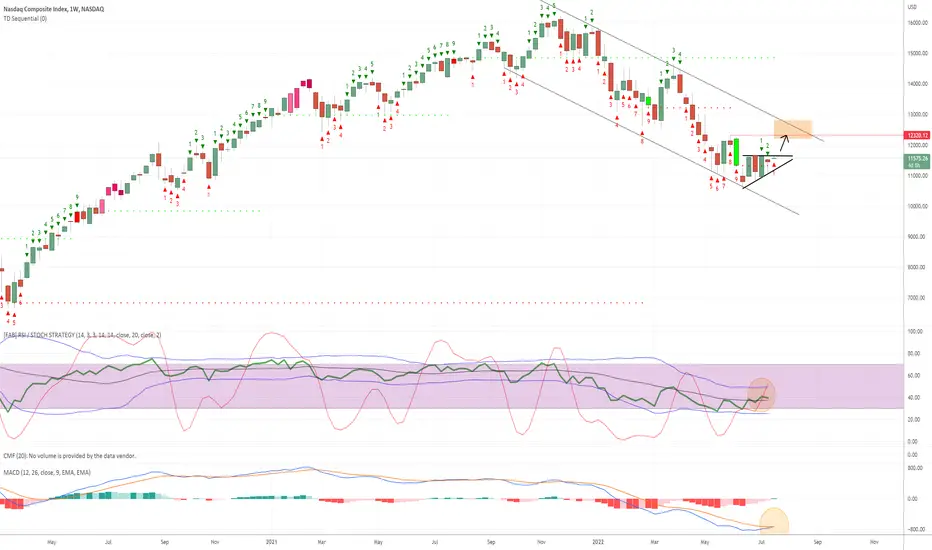
NASDAQ may reclaim 12000Ascending triangle within descending channel.
Momentum up, MACD about to flip.
Let's wait for the FED on the 28th and evaluate.
DYOR.
Double bottom this year, then hits previous ATH, Q4 2023Double bottom this year, then hits previous ATH, Q4 2023.
The world isn't going to stop spinning.

Nasdaq/M2 Money Stock: Unclear where we go from hereJust recording this graphic for the future.
The Nasdaq 100 has had a great past decade, but now we're at a critical time for the tech-heavy Nasdaq index When looking at Nasdaq divided by the Money Supply, news about how the feds will guide the US economy will force people to make a decision about their portfolios:
Do you diamond hand your tech stocks or dump them and wait for a better position?


gaps for the history booksit seems, six gaps from the June low. there's no tomorrow. I don't understand it but spectacular market move.

Cup and handlewe are in the way to shape a cup with handle. it may close down during the following few days.

Nasdaq Composite dropping. IXICIt is appearing to be doing so along with the other major indices and there is plenty of data to speculate that the drop will continue technically and from a valuation standpoint. How low are we going? No one knows, but we have charted a few goals reasonable to us. A book can be written on how we derive the goals, so we won't bore you now.
We are not in the business of getting every prediction right, no one ever does and that is not the aim of the game. The Fibonacci targets are highlighted in purple with invalidation in red. Confirmation level, where relevant, is a pink dotted, finite line. Fibonacci goals, it is prudent to suggest, are nothing more than mere fractally evident and therefore statistically likely levels that the market will go to. Having said that, the market will always do what it wants and always has a mind of its own. Therefore, none of this is financial advice, so do your own research and rely only on your own analysis. Trading is a true one man sport. Good luck out there and stay safe.

NASDAQ My Bullish ViewNASDAQ My Bullish View. USA Stocks in NASDAQ Index should be bullish in long term.

Nasdaq at an area of valueNASDAQ:IXIC is at an area of interest, near a potential resistance level but also trading above a key MA. Friday close will be interesting, a solid close above this MA might bring a bull run. Failure to push up will bring us back to the boring "correction" environment. I'm rooting for the upside.

IXIC/SPX signs of risk onas IXIC/SPX seems to be breaking above support bands, hopeful of course, still need to see how this plays out, the SPX/IXIC, obviously will be the inverse and losing ground, and when pulled up can see breaking down back into the support band channels

IXIC vs USM2 in 2000's bubble and currentlyI think if we get out of the blue channel...it gets exciting and some narrative drives us forward. may be around fall election times...any number of macro announcements could cause a run if we are out of the channel...

Nasdaq Composite Comparison to 2021$IXIC Nasdaq Composite now vs. then 2021. Notice the resemblance to channel support/resistances aligned with the bubble spike above channel between the two charts and then notice the 8month MA (yellow) vs. 50month MA (red). The chart is extremely earie, and you need to take notice.
Current:
Then (2021):

Potential diamond forming I know this pattern can be hard to spot but this looks pretty good to me. We also have a bullish divergence on the RSI with a break of resistance and a backtest of that resistance line. Will be watching closely next week for the next candle

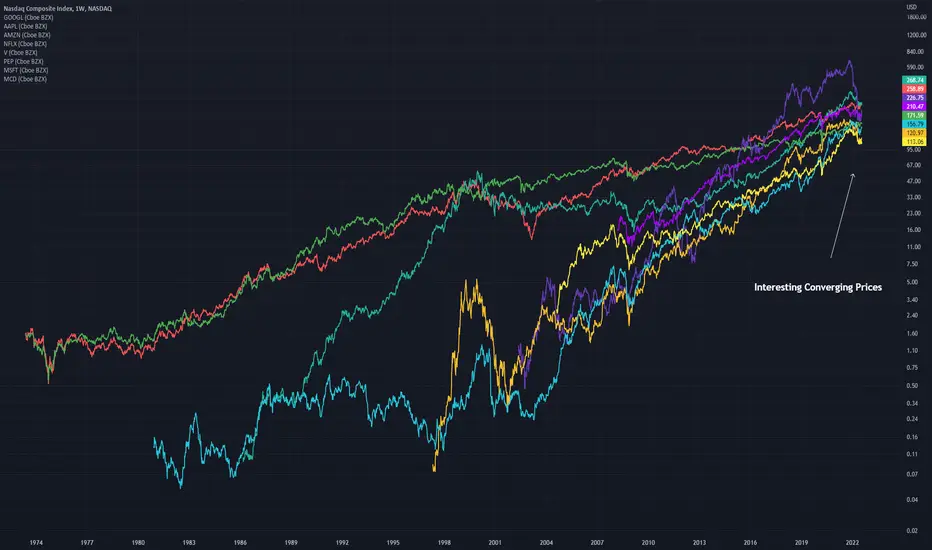
Top Performing Stocks ConvergenceAn Idea showing some of the best performing stocks
GOOGL
AAPL
AMZN
NFLX
V
PEP
MSFT
MCD
I find it interesting how they are all converging to the same point. Do you find this observation to be bearish or bullish? Or nothing at all?
The Global Reset will crash economy for digital dollar If you haven't figured it out yet. The markets are bought up by the US government. They are the largest shareholder with trillions of fake money pumped into markets. There is an actual government organization called the PPT that was put into place to keep markets from crashing.
The organization has evolved to basically buy stocks all day to keep inflating stock market to inflate consumer confidence. This is basically an unnatural market. The scam works like this. The government prints fake money to buy stocks and when these are sold by investors the fake money becomes real money and makes an impact in the economy as a large portion of it is recirculated into economy.
That being said. A major event is likely planned by the government to crash stock market as an attempt to mandate a digital dollar currency. Bitcoin is likely an experiment of the US government as well.
Long story short. Either the governments plan will work or God will reak havoc and end the manipulation before this happens. Even if we go digital God will have the last laugh. Even though he wouldn't laugh if you know what I mean.
Markets can get irrational even more and go way beyond the thick red line even into 17k territory but let's hope this ends quicker then that


Nasdaq Composite Summary - Week of 7/15/2022Summary of weekly price and volume action, as well as net new highs and lows, on the Nasdaq Composite for the week of 7/15/2022.
Click on the chart below to view the details:

Nasdaq Downside continues 15 July 2022Looks like this downwards trend range, is dominating the market.
It looks like the price will head on up on thin volume, before it makes its next down wave...
What do you think?
Trade well, live free.
Timon
Founder, MATI Trader

Head and Shoulders on NASDAQ ChartHead and Shoulders on NASDAQ chart (mirrors Inverse H&S on DYX chart).
