Nasdaq may begin to go down as the 5th wave may have completedIf this right, Nasdaq ( TVC:IXIC ) will then have a much larger correction in the following months
But honestly it's hard to forecast the top
IXIC trade ideas

Market Week in Review - 7/12/2021 - 7/16/2021Summary: Worries over the health and speed of the recovering economy remained this week, and the big mega-caps weren't enough to keep the indexes moving higher. Investors weren't sure what to do with a mixed bag of economic data, causing volatility in bonds and equities.
Notes
The Market Week in Review is my weekend homework where I look over what happened in the previous week and what might come in the next week.
I occasionally have some errors or typos and will correct them in my blog or the comments on TradingView. I do not have an editor and do this in my free time.
If you find this helpful, please let me know in the comments. I am also more than happy to add new perspectives and data points if you have ideas.
The structure is the following:
A recap of the daily updates that I do here on TradingView.
View on the past week
What's coming in the next week
The Bullish View, The Bearish View
Key index levels to watch out for
Wrap-up
If you have been following my daily updates, you can skip down to "View on the Week." If not, then this first part is a great play-by-play recap for the week. Click the daily charts for more detail on sectors, indexes, and market leaders each day.
-=x=-=x=-=x=-=x=-=x=-=x=-=x=-
Monday, July 12, 2021
Facts: +0.21%, Volume higher, Closing range: 69%, Body: 12%
Good: Higher high, higher low, body and closing range in upper half of candle
Bad: Red body, low advance/decline ratio
Highs/Lows: Higher high, higher low
Candle: Thin red body in upper half of the candle, long lower wick from morning dip
Advanced/Decline: 0.8, more declining stocks than advancing stocks
Indexes: SPX (+0.35%), DJI (+0.36%), RUT (+0.08%), VIX (-0.06%)
Sectors: Financials (XLF +0.98%) and Real Estate (XLRE +0.87%) at the top. Energy (XLE -0.15%) and Consumer Staples (XPL -0.16%) were the bottom.
Expectation: Sideways or Higher
New all-time highs across three of the major indexes is not a bad way to start the week. The 10-year Treasury note auction passed without many surprises, giving the indexes a boost in the afternoon.
The Nasdaq closed with a +0.21% advance on slightly higher volume. The candle shows a bit of indecision as markets dipped in the morning but then recovered and made gains in the afternoon after the auction. The 12% Red body in the upper half of the candle is above a long lower wick. The closing range is 69%. There were more declining stocks than advancing stocks.
-=x=-=x=-=x=-=x=-=x=-=x=-=x=-
Tuesday, July 13, 2021
Facts: -0.38%, Volume higher, Closing range: 12%, Body: 26%
Good: Higher high, outside day that keeps index in uptrend, support at ~14,675
Bad: Long upper wick from afternoon selling, red body at bottom of candle
Highs/Lows: Higher high, lower low
Candle: Outside day, long upper wick signals a bearish reversal day
Advanced/Decline: 0.21, five decline stocks for every advancing stock
Indexes: SPX (-0.35%), DJI (-0.31%), RUT (-1.88%), VIX (+5.88%)
Sectors: Technology (XLK +0.41%) and Consumer Staples (XLP -0.03%) at the top. Consumer Discretionary (XLY -1.20%) and Real Estate (XLRE -1.30%) were the bottom.
Expectation: Lower
Higher than expected inflation data wasn't enough to keep the indexes from making new highs, but the rally couldn't last, and markets closed lower on Tuesday. A weaker than expected 30y bond auction sent yields higher and spooked investors in the afternoon. Big tech held onto gains, helping the Technology sector end the day in the positive.
The Nasdaq closed the day with a -0.38% loss on higher volume. The candle has a long upper wick that represents the morning rally which turned into an afternoon sell-off. The 26% red body sits at the bottom of the candle, creating a 12% closing range above a short lower wick. The outside day with a bearish reversal confirms the underlying weakness where five stocks declined for every advancing stock.
-=x=-=x=-=x=-=x=-=x=-=x=-=x=-
Wednesday, July 14, 2021
Facts: -0.22%, Volume lower, Closing range: 8%, Body: 86%
Good: Nothing
Bad: Thick red body, closing range, lower high
Highs/Lows: Lower high, lower low
Candle: Mostly red body surrounded by tiny wicks
Advanced/Decline: 0.28, more than three decline stocks for every advancing stock
Indexes: SPX (+0.12%), DJI (+0.13%), RUT (-1.63%), VIX (-4.62%)
Sectors: Consumer Staples (XLP +0.89%) and Real Estate (XLRE +0.88%) at the top. Financials (XLF -0.46%) and Energy (XLE -2.98%) were the bottom.
Expectation: Lower
Apple gets an upgrade, and big tech rises again as the rest of the market fades around it. Producer Price Index data was higher than expected. Still, Jerome Powell continued to focus on inflation being transitory and the need for further economic support until the jobs market fully recovers.
Despite the advances in big tech, the Nasdaq closed -0.22% lower. Showing the lopsided gains in the market, the QQQ ETF (weighted by cap size) was up +0.18%, while the QQQE ETF (equal-weighted) was down -0.12%. The Nasdaq candle is almost all red body (86%), with tiny upper and lower wicks. The closing range is 8%. There were more than three declining stocks for every advancing stock.
-=x=-=x=-=x=-=x=-=x=-=x=-=x=-
Thursday, July 15, 2021
Facts: -0.70%, Volume higher, Closing range: 46%, Body: 47%
Good: Bounce off support at 21d EMA
Bad: Another LH/LL on slightly higher volume
Highs/Lows: Lower high, lower low
Candle: Thick red body in upper half of candle, long lower wick
Advanced/Decline: 0.5, two declining stocks for every advancing stock
Indexes: SPX (-0.33%), DJI (+0.15%), RUT (-0.55%), VIX (+4.17%)
Sectors: Utilities (XLU +1.13%) and Consumer Staples (XLP +0.41%) at the top. Technology (XLK -0.82%) and Energy (XLE -1.40%) were bottom
Expectation: Sideways or Lower
Is the big tech trade finished? Or is this just a pause before another leg up? Economic data in the morning caused volatility at the market open, which eventually went to the bears. The selling continued until the afternoon when the buyers came back into the market.
The Nasdaq closed the day with a -0.70% loss on slightly higher volume. The candle has a thick red body in the upper half and a long lower wick in the lower half. The closing range is 46%, and the body covers 47% of the candle. There were two declining stocks for every advancing stock.
-=x=-=x=-=x=-=x=-=x=-=x=-=x=-
Friday, July 16, 2021
Facts: -0.80%, Volume lower, Closing range: 7%, Body: 81%
Good: Nothing
Bad: Close below 21d EMA, mostly red body, low closing range
Highs/Lows: Lower high, lower low
Candle: Almost entirely red body, upper wick longer than lower wick
Advanced/Decline: 0.32, three declining stocks for every advancing stock
Indexes: SPX (-0.75%), DJI (-0.86%), RUT (-1.24%), VIX (+8.47%)
Sectors: Utilities (XLU +1.01%) and Health (XLV +0.27%) at the top. Materials (XLB -1.51%) and Energy (XLE -2.83%) were bottom.
Expectation: Lower
The market gave us a painful Friday to end a painful week. Utilities were again the top sector as investors took defensive positions brought on by worries over the pandemic and a slowing economic recovery.
The Nasdaq closed with a -0.8% loss. Volume was lower, but the candle was distinctly bearish with a large 81% red body and a dismal 7% closing range. The upper wick, created by an early morning rally, is slightly longer than the lower wick. The index got some support at 14,500 but quickly reversed, moving below the 21-day exponential moving average. There were three declining stocks for every advancing stock.
-=x=-=x=-=x=-=x=-=x=-=x=-=x=-
View on the Week
Worries over the health and speed of the recovering economy remained this week, and the big mega-caps weren't enough to keep the indexes moving higher. Investors weren't sure what to do with a mixed bag of economic data, causing volatility in bonds and equities.
All seemed ok after an uneventful 10-year Treasury note auction on Monday. That was the only news of the day. After the auction, the Nasdaq rallied into close and continued the rally into the following day. That's when the trouble started.
Tuesday kicked off with higher than expected Consumer Price Index data. Equities continued to rally, but the inflation worries hit the 30-year bond auction. The low demand for the bond sent yields higher. Only big tech companies held onto gains by the end of the day.
The big tech rally got another boost on Wednesday when JP Morgan analysts upgraded the price target for Apple after news that the company is boosting iPhone production by as much as 20%. The rally extended to other tech mega-caps and set up a situation where a pullback for the big tech stocks was due.
On Thursday, Federal Reserve Banks in New York and Philadelphia released their Manufacturing Data. The New York numbers were at all-time highs while the Philadelphia numbers were lower than expected. Although the Philadelphia numbers were below expectations, they are still high on a historical basis. The numbers supported the narrative that the economic recovery is slowing, sending Treasury Yields back down to where they started the week. And yet, the US Dollar strengthened.
The economic worries, volatility in bonds, and extended prices in big tech all combined to sink the indexes lower on Friday, closing a painful week for growth investors.
The Nasdaq declined -1.87% for the week. Volume was higher than the previous week. Despite the decline, the index did manage a higher high and a higher low for the week. The closing range of 4% is the lowest in over a year, representing the selling into the close that occurred on Friday.
Small Caps suffered the most this week, with the Russell 2000 (RUT) dropping -5.12%. The S&P 500 (SPX) declined -0.97% for the week. The Dow Jones Industrial Average (DJI) lost -0.52%.
The VIX volatility advanced +14.04% for the week.
The sectors ended the week in a very character than they started the week. None of the leading sectors early in the week were leading by the end of the week.
Financials ( XLF ) started the week in first as investors anticipated earnings reports from big banks that began on Tuesday. By Friday, the sector slipped to the middle of the list, ending the week with a -1.61% decline.
Technology ( XLK ) and Communication Services ( XLC ) took over the top spots for Tuesday and most of Wednesday. They also reversed downward and ended the week with losses.
The only sectors to end the week with gains were Utilities ( XLU ), Consumer Staples ( XLP ), and Real Estate ( XLRE ). The defensive sectors gained ground at the end of the week as worries over the economy grew among investors.
Energy ( XLE ) was at the bottom of the list, dropping -7.89% this week. OPEC+ continues to have disagreements, destabilizing the sector along with the price of oil. Add the fears of a slowing recovery, and investors are exiting positions in the sector that performed well in the first half of 2021.
Treasury yields on the 30y bond and 10y note slid further this week. Although the 10y note auction passed without surprises, the 30y bond auction was weaker than expected, causing yields to rise midweek. However, the levels returned to where they started the week, and the slide continues. The 2y yields rose slightly for the week as the yield curve continues to flatten. The signal to read here is that investors see more risk in shorter-term debt, requiring more reward (yield). The outlook for the short term is growing more negative.
High Yield Corporate Bond (HYG) prices declined but remained near pre-pandemic highs. Investment Grade Bond (LQD) prices advanced.
The US Dollar (DXY) advanced +0.66% for the week.
Silver (SILVER) declined -1.70%, and Gold (GOLD) advanced +0.16%.
Crude Oil (CRUDEOIL1!) declined -3.20%.
Timber (WOOD) advanced -4.30%.
Copper (COPPER1!) declined +-0.12%.
Aluminum (ALI1!) declined -0.61%.
-=x=-=x=-=x=-=x=-=x=-=x=-=x=-
Big Four Mega-caps
Three of the four largest mega-caps advanced for the week. Alphabet (GOOGL) had the biggest gain with a +1.16% advance. Microsoft (MSFT) gained +1.01%. Apple (AAPL) rose +0.88%. All three pulled back from intra-week highs on Thursday and Friday. Amazon (AMZN) dropped -3.92% for the week. All four are trading above key moving averages.
-=x=-=x=-=x=-=x=-=x=-=x=-=x=-
The Four Recovery Stocks
I picked four recovery stocks to track against the indexes and other indicators in this weekly report. The situation was not good for the four recovery stocks. Carnival Cruise Lines (CCL) took the biggest hit with a -13.77% decline, dropping below the 40w moving average. Delta Airlines (DAL) declined -6.66%, despite beating all analyst expectations on the top line, bottom line, and key metrics. Marriott (MAR) fell -5.21%. Exxon Mobil (XOM) dropped -6.39%, pulling the Energy sector lower.
-=x=-=x=-=x=-=x=-=x=-=x=-=x=-
Cryptocurrency
I started tracking four major cryptocurrencies on the week in review. The four are Bitcoin, Ethereum, Litecoin, and Bitcoin Cash. The latter two are not the largest by market cap but seem to be well-known and are part of the CIX capital.com index, tracking five cryptocurrencies, including these four (Ripple is the fifth).
The declines continue in the four cryptocurrencies. Bitcoin (BTCUSD) lose another -7.44%. Ethereum (ETHUSD) dropped -10.98%. Litecoin (LTCUSD) declined -10.70%. Bitcoin Cash (BCHUSD) fell -11.76%.
-=x=-=x=-=x=-=x=-=x=-=x=-=x=-
Investor Sentiment
The put/call ratio (PCCE) ended the week at 0.859. A contrarian indicator, when the put/call ratio is below 0.7, it signals overly bullish sentiment and could mean an overbought market.
The CNN Fear & Greed Index moved into the Extreme Fear level. The indicator is at 23, which is the lowest since the 2020 pandemic crash.
The NAAIM Money Manager exposure index rose to 93.27 this week.
The survey occurs on Wednesdays, so the number does not include any selling on Thursday and Friday. However, it's still interesting that the index rose after the previous week where the market was already weakening.
-=x=-=x=-=x=-=x=-=x=-=x=-=x=-
The Week Ahead
The week will start slow, but earnings reports will pick up as Financials kick off the earnings season.
Monday
There is not much economic news scheduled for Monday.
IBM will release earnings on Monday, which may be an early indicator of what's to come from other tech giants this earnings season.
Tuesday
Building Permits and Housing Starts data will be available on Tuesday morning before the market opens. API Weekly Crude Oil Stock gets released after the market closes.
Netflix (NFLX), Philip Morris (PM), Chipotle (CMG), KeyCorp (KEY), Haliburton (HAL), and United Airlines (UAL) will report earnings on Tuesday.
Wednesday
Crude Oil Inventories are the primary economic data for Wednesday, although some may be interested in Mortgage data released before the market opens.
Johnson & Johnson (JNJ), ASML Holding (ASML), Coca-Cola (KO), Verizon (VZ), and Fidelity Financial (FNF) are some of the interesting reports for Wednesday. Analysts will listen closely to Coca-Cola statements around supply chain costs and whether they are transferring increased costs along to consumers.
Thursday
The weekly Initial Jobless Claims become available on Thursday before the market opens. After the market opens, Investors will get Existing Home Sales data for June.
Intel (INTC), Abbott Labs (ABT), AT&T (T), Snap (SNAP), ABB (ABB), Twitter (TWTR), DR Horton (DHI), Southwest Airlines (LUV), Dominos Pizza (DPZ), and American Airlines (AAL) release earnings on Thursday.
Friday
The Manufacturing and Services purchasing manager indexes released on Friday will be another indicator of economic activity and the speed of the recovery.
Friday's earning reports include Honeywell (HON), American Express (AXP), and Schlumberger (SLB).
-=x=-=x=-=x=-=x=-=x=-=x=-=x=-
The Bullish Side
There may be a slowdown in the speed of growth compared to the first half of the year, but the economy is still expanding at a historically high rate. The US Dollar is strengthening. Investors continue to support high prices (low yields) in both investment grade and junk corporate bonds, showing confidence in US businesses to be successful in the near term.
That confidence is coming from the ability for businesses to secure low interest rates for debt to fund growth, while consumers are continuing to drive demand via increased activity (Retail Sales is higher than expected). Inflation remains high, but consumers are still purchasing, using a record amount of savings to fund new purchases.
The Fed's Jerome Powell reaffirmed again this week that they believe inflation is transitory, but they are more than willing to step in to control inflation. Although an interest rate hike would cause some pause, the bigger evil for growth stocks is out-of-control inflation. The slightly more hawkish Fed can help growth investors remain confident in the market.
-=x=-=x=-=x=-=x=-=x=-=x=-=x=-
The Bearish Side
At all-time highs, the market was due for a pullback. Despite gains among big tech, the last two weeks have shown a broader weakness in equities. Much of that is from fears of a slowing economic recovery, driving volatility in the bond market, and spilling over into equities.
Although Retail sales were higher than expected, Consumer sentiment and expectations data were low. Analysts expected the consumer numbers to be higher since we are emerging from the long pandemic. However, it seems consumers are worried about new variants and also stressed by higher prices for goods.
The question is, will there be a further correction, or is the minor pullback this week enough to get support and move higher. The CNN Fear & Greed index moved into the Extreme Fear range, based primarily on the weakness in stock prices and high demand for long-term bonds. That means big investors see a worsening situation on the horizon and possibly a move lower for the indexes.
-=x=-=x=-=x=-=x=-=x=-=x=-=x=-
Key Nasdaq Levels to Watch
The Nasdaq set another all-time high this week before pulling back again and closing below the 21d exponential moving average. The index closed with a higher low but with a dismal closing range, sliding into the end of the week.
On the positive side, the levels are:
The 21d EMA is at 14449.77.
14,500 has been a support area in the past, get back above this area to move higher.
The 10d MA is at 14,625.59.
The high of this past week was a new all-time high at 14,803.68.
The mid-point of the regression trend from the 5/12 low points to 14,989 by the end of the week.
The round number 15,000 is likely to be a new area of resistance.
On the downside, there are a few key levels:
The low of this past week is 14,413.32.
The low of the previous week is 14,371.59. Keep making higher lows to keep the uptrend intact.
The 50d MA is at 14,004.19.
14,000 has been a key area of support/resistance.
There is a pivot at 13,548.93.
There is a support area at 13,000. 13,002.54 is a pivot from May.
13,119.60 is the 200d MA.
12,397.05 is a low pivot point from the early March dip.
-=x=-=x=-=x=-=x=-=x=-=x=-=x=-
Wrap-up
It was a tough week, especially for growth investors. Economic signals are all over the place, causing reactions among investors. Ultimately, volatility will have investors exiting riskier positions and moving to safe-havens. We saw that through the increased demand for long-term bonds and the rise of defensive sectors to the top of the sector list the past two weeks.
As it stands, the Nasdaq is still in an uptrend. It looks worrisome, but we have to wait and see what happens in the coming week. A further decline could mean a 5-6% correction before the uptrend resumes. Or the index could turn back toward new all-time highs sooner if new data indicate a more robust economic recovery.
Good luck, stay healthy, and trade safe!

Daily Market Update for 7/16Summary: The market gave us a painful Friday to end a painful week. Utilities were again the top sector as investors took defensive positions brought on by worries over the pandemic and a slowing economic recovery.
Notes
Ideas always welcome in the comments. Errors will be amended as comments on TradingView or corrected inline in my blog.
-=x=-=x=-=x=-=x=-=x=-=x=-=x=-
Friday, July 16, 2021
Facts: -0.80%, Volume lower, Closing range: 7%, Body: 81%
Good: Nothing
Bad: Close below 21d EMA, mostly red body, low closing range
Highs/Lows: Lower high, lower low
Candle: Almost entirely red body, upper wick longer than lower wick
Advanced/Decline: 0.32, three declining stocks for every advancing stock
Indexes: SPX (-0.75%), DJI (-0.86%), RUT (-1.24%), VIX (+8.47%)
Sectors: Utilities (XLU +1.01%) and Health (XLV +0.27%) at the top. Materials (XLB -1.51%) and Energy (XLE -2.83%) were bottom.
Expectation: Lower
-=x=-=x=-=x=-=x=-=x=-=x=-=x=-
Market Overview
The market gave us a painful Friday to end a painful week. Utilities were again the top sector as investors took defensive positions brought on by worries over the pandemic and a slowing economic recovery.
The Nasdaq closed with a -0.8% loss. Volume was lower, but the candle was distinctly bearish with a large 81% red body and a dismal 7% closing range. The upper wick, created by an early morning rally, is slightly longer than the lower wick. The index got some support at 14,500 but quickly reversed, moving below the 21-day exponential moving average. There were three declining stocks for every advancing stock.
The Russell 2000 (RUT) was again the worst major index for the day, declining -1.24%. Investors have been exiting small-cap stocks and rotating back into big tech and growth stocks. The Dow Jones Industrial Average (DJI) fell -0.86%. The S&P 500 (SPX) dropped -0.75%.
The defensive sectors were at the top of the sector list for another day and topped the weekly list. Utilities (XLU +1.01%) and Health (XLV +0.27%) were the best performing sectors. Materials (XLB -1.51%) and Energy (XLE -2.83%) were the worst-performing.
-=x=-=x=-=x=-=x=-=x=-=x=-=x=-
Economic Indicators
Retail Sales data came in higher than expected. However, Consumer Expectations and Sentiment surprised analysts with lower numbers than expected. Analysts expected higher sentiment because the US is emerging from the pandemic and getting back to a somewhat normal life. The lower number adds some worry that the recovery is slowing among concerns over inflation and new virus variants.
The US Dollar (DXY) rose +0.16% for the day.
The US 30y Treasury Yield rose slightly, while the 10y and 2y Yields declined.
High Yield Corporate Bond (HYG) and Investment Grade Corporate Bond (LQD) prices declined.
Silver (SILVER) and Gold (GOLD) declined sharply.
Crude Oil (CRUDEOIL1!) declined.
Timber (Wood) also declined sharply.
Copper (COPPER1!) advanced, and Aluminum (ALI1!) declined.
Bitcoin (BTCUSD) declined -1.45%. Ethereum (ETHUSD) declined -2.05%.
-=x=-=x=-=x=-=x=-=x=-=x=-=x=-
Investor Sentiment
The put/call ratio rose to 0.859, showing investors getting more bearish. The put/call ratio (PCCE) is a contrarian indicator that shows overly bullish or overly bearish investor behavior. The 0.7 level is considered normal. Below that level is overly bullish.
The CNN Fear & Greed index moved into extreme fear. The extreme fear indicator is driven by demand for bonds (lower yields), higher put/call ratio, and weakening stock prices. Interestingly, the Junk Bond component still shows Greed.
The NAAIM Money Manager exposure index rose to 93.27 this week.
-=x=-=x=-=x=-=x=-=x=-=x=-=x=-
Market Leaders
All big four mega-caps declined again today. Amazon (AMZN) declined the most this week, adding a -1.59% drop this week and closing just above its 21d EMA. Apple (AAPL) fell -1.41%. Microsoft (MSFT) and Alphabet (GOOGL) had smaller losses, declining -0.10% and -0.03%, respectively.
The top mega-caps for today are Oracle (ORCL), Danaher (DHR), Novo Nordisk (NVO), and Thermo Fischer (TMO). Danaher and Novo Nordisk are new to the list, topping the $200 billion market cap with gains this week as the Health sector picks up momentum. At the bottom of the list are Nvidia (NVDA), Exxon Mobil (XOM), Walt Disney (DIS), and ASML Holding (ASML).
The daily update growth stock list continued a tough week with more losers than gainers. Sumo Digital (SUMO), DocuSign (DOCU), Fastly (FSLY), and Zoom (ZM) were at the top of the list. The
-=x=-=x=-=x=-=x=-=x=-=x=-=x=-
Looking ahead
There is not much economic news scheduled for Monday.
IBM will release earnings on Monday, which may be an early indicator of what's to come from other tech giants this earnings season.
-=x=-=x=-=x=-=x=-=x=-=x=-=x=-
Trends, Support, and Resistance
The Nasdaq closed below the 21d exponential moving average line today.
I removed the trend line from the 5/12 low and added a new trend line from the 7/13 high.
The five-day trend line points to a -0.07% decline for Monday.
The trend-line from the 7/13 high ends with a -0.58% loss.
The one-day trend line points to a -0.76% loss.
-=x=-=x=-=x=-=x=-=x=-=x=-=x=-
Wrap-up
Gains over the past week have been focused mainly on big tech, while the rest of the market showed weakness. Investors are worried that the economic recovery is slowing, and that will hurt smaller companies the most. Big tech could only carry the indexes to a certain point and was due for a pullback. We'll have to wait for next week to see if there is a further correction or if the outlook will improve and support comes back into equities.
Stay healthy and trade safe!

Nasdaq SingularityIn the Singularity (year 2030), tech accelerates faster than humans comprehend,
so the only way humans can survive is by owning tech stocks.


Daily Market Update for 7/15Summary: Is the big tech trade finished? Or is this just a pause before another leg up? Economic data in the morning caused volatility at the market open, which eventually went to the bears. The selling continued until the afternoon when the buyers came back into the market.
Notes
Ideas always welcome in the comments. Errors will be amended as comments on TradingView or corrected inline in my blog.
-=x=-=x=-=x=-=x=-=x=-=x=-=x=-
Thursday, July 15, 2021
Facts: -0.70%, Volume higher, Closing range: 46%, Body: 47%
Good: Bounce off support at 21d EMA
Bad: Another LH/LL on slightly higher volume
Highs/Lows: Lower high, lower low
Candle: Thick red body in upper half of candle, long lower wick
Advanced/Decline: 0.5, two declining stocks for every advancing stock
Indexes: SPX (-0.33%), DJI (+0.15%), RUT (-0.55%), VIX (+4.17%)
Sectors: Utilities (XLU +1.13%) and Consumer Staples (XLP +0.41%) at the top. Technology (XLK -0.82%) and Energy (XLE -1.40%) were bottom
Expectation: Sideways or Lower
-=x=-=x=-=x=-=x=-=x=-=x=-=x=-
Market Overview
Is the big tech trade finished? Or is this just a pause before another leg up? Economic data in the morning caused volatility at the market open, which eventually went to the bears. The selling continued until the afternoon when the buyers came back into the market.
The Nasdaq closed the day with a -0.70% loss on slightly higher volume. The candle has a thick red body in the upper half and a long lower wick in the lower half. The closing range is 46%, and the body covers 47% of the candle. There were two declining stocks for every advancing stock.
The Dow Jones Industrial Average (DJI) gained +0.15%. The S&P 500 (SPX) declined -0.33%. The Russell 2000 (RUT) dropped another -0.55%.
The defensive sectors were at the top of the sector list again today. Utilities (XLU +1.13%) and Consumer Staples (XLP +0.41%) were the best performing sectors, signaling the unease over continued inflation and uncertainty in the economic recovery. Technology (XLK -0.82%) had its first decline after five days of gains. Energy (XLE -1.40%) continues to slide.
-=x=-=x=-=x=-=x=-=x=-=x=-=x=-
Economic Indicators
Continuing Jobless Claims continues to fall while Initial Jobless Claims was even, meeting expectations. The NY Empire State Manufacturing Index blew away expectations at 43 (analysts expected 18). However, the Philadelphia Fed Manufacturing Index fell to 21.9, well below expectations. Regardless, the Philly index is still at a historically high level.
The US Dollar (DXY) rose +0.21% for the day.
The US 30y and 10y Treasury yields fell significantly again while the 2y Treasury yield remained even. Bond investors listened closely to the Fed Jerome Powell's comments in front of the Senate this week. Powell is walking a line between calming fears over inflation and letting people know the Fed is willing to step in and control inflation if it proves not as transitory as expected.
High Yield Corporate Bond (HYG) bond prices declined. Investment Grade Corporate Bond (LQD) prices advanced.
Silver (SILVER) and Gold (GOLD) advanced.
Crude Oil (CRUDEOIL1!) declined.
Timber (Wood) declined.
Copper (COPPER1!) advanced, and Aluminum (ALI1!) declined.
Bitcoin (BTCUSD) declined -3.21%. Ethereum (ETHUSD) declined -3.57%. (Time of writing)
-=x=-=x=-=x=-=x=-=x=-=x=-=x=-
Investor Sentiment
The put/call ratio rose to 0.764. The put/call ratio (PCCE) is a contrarian indicator that shows overly bullish or overly bearish investor behavior. The 0.7 level is considered normal. Below that level is overly bullish.
The CNN Fear & Greed index moved more into the fear side, getting closer to extreme fear.
The NAAIM Money Manager exposure index rose to 93.27. Buying the dip?
-=x=-=x=-=x=-=x=-=x=-=x=-=x=-
Market Leaders
All big four mega-caps declined today but remain well above key moving average lines. Amazon (AMZN) had the biggest loss, declining -1.37%. Alphabet (GOOGL) declined -0.96%. Microsoft (MSFT) fell -0.52%. Apple (AAPL) lost -0.45%.
Danaher Corporation (DHR) barely rose above 200B market capitalization to make it into the mega-cap list. The stock tops the list today with a +1.75% gain. Alibaba (BABA), United Health (UNH), and Home Depot (HD) were the other top mega-caps for the day. Taiwan Semiconductor (TSM) is at the bottom of the list with a -5.51% decline. The company released earnings before the market open. They increased profits from the previous year but were still slightly below analyst expectations. Also at the bottom of the mega-cap list is Nvidia (NVDA), Oracle (ORCL), and Eli Lilly (LLY).
It has not been a good week for growth stocks. Most of the stocks in the daily update list declined for another day. Chinese stocks did well, with FUTU Holdings (FUTU), UP Fintech (TIGR), JD.com (JD), and Alibaba (BABA) topping the growth list. At the bottom of the list are Fiverr (FVRR), SNAP (SNAP), Enphase (ENPH), and Nvidia (NVDA).
-=x=-=x=-=x=-=x=-=x=-=x=-=x=-
Looking ahead
The focus will be on Retail Sales data on Friday morning. Consumer Sentiment and Consumer Expectations data will be available after the market opens. Consumer Inflation Expectations will also watch closely as higher expectations tend to play out to be self-fulfilling.
Friday's earning reports include Honeywell (HON) and Charles Schwab (SCHW).
-=x=-=x=-=x=-=x=-=x=-=x=-=x=-
Trends, Support, and Resistance
Support around 14,650 did not hold. However, the index did get support at the 21d exponential moving average line. Buyers came back into the market at soon as the index hit the line.
The trend line from the 5/12 low shows a +2.11% gain for Friday. If the index moves lower from here, I'll retire this long trend-line and replace it with a line from the 7/14 top. There is nothing to complain about a two-month uptrend.
The five-day trend line leads to a 0.22% gain.
The one-day trend line points to a -1.16% loss.
-=x=-=x=-=x=-=x=-=x=-=x=-=x=-
Wrap-up
There were likely several things at play in today's decline:
1. Big tech companies were due for a pullback. As the primary source of gains over the past week, the pullback of big tech impacted the major indexes.
2. The Philly manufacturing index number coming in lower than expected was a shocker for investors, despite being historically high.
3. Whether yields go up or down, volatility in the bond market is never good for equities.
There's a great quote from Steve Eisman in The Big Short (book): "The equity world is like a f***ing zit compared to the bond market." Truth.
Stay healthy and trade safe!

Daily Market Update for 7/14Summary: Apple gets an upgrade, and big tech rises again as the rest of the market fades around it. Producer Price Index data was higher than expected. Still, Jerome Powell continued to focus on inflation being transitory and the need for further economic support until the jobs market fully recovers.
Notes
Ideas always welcome in the comments. Errors will be amended as comments on TradingView or corrected inline in my blog.
-=x=-=x=-=x=-=x=-=x=-=x=-=x=-
Wednesday, July 14, 2021
Facts: -0.22%, Volume lower, Closing range: 8%, Body: 86%
Good: Nothing
Bad: Thick red body, closing range, lower high
Highs/Lows: Lower high, lower low
Candle: Mostly red body surrounded by tiny wicks
Advanced/Decline: 0.28, more than three decline stocks for every advancing stock
Indexes: SPX (+0.12%), DJI (+0.13%), RUT (-1.63%), VIX (-4.62%)
Sectors: Consumer Staples (XLP +0.89%) and Real Estate (XLRE +0.88%) at the top. Financials (XLF -0.46%) and Energy (XLE -2.98%) were the bottom.
Expectation: Lower
-=x=-=x=-=x=-=x=-=x=-=x=-=x=-
Market Overview
Apple gets an upgrade, and big tech rises again as the rest of the market fades around it. Producer Price Index data was higher than expected. Still, Jerome Powell continued to focus on inflation being transitory and the need for further economic support until the jobs market fully recovers.
Despite the advances in big tech, the Nasdaq closed -0.22% lower. Showing the lopsided gains in the market, the QQQ ETF (weighted by cap size) was up +0.18%, while the QQQE ETF (equal-weighted) was down -0.12%. The Nasdaq candle is almost all red body (86%), with tiny upper and lower wicks. The closing range is 8%. There were more than three declining stocks for every advancing stock.
The Dow Jones Industrial Average (DJI) gained +0.13%, while the S&P 500 (SPX) advanced +0.12%. The Russell 2000 (RUT) continues to slide with a -1.63% loss today.
The defensive sectors were at the top of the sector list today. Consumer Staples (XLP +0.89%) and Real Estate (XLRE +0.88%) at the top. Utilities (XLU +0.87%) was third. With the help of the big mega-caps, Technology (XLK +0.74%) also ended the day with gains.
-=x=-=x=-=x=-=x=-=x=-=x=-=x=-
Economic Indicators
The US Dollar (DXY) declined -0.44% for the day.
The US 30y, 10y, and 2y Treasury yields declined for the day. Yields were already falling in the morning, but further declines came after Powell's testimony.
High Yield Corporate Bond (HYG) and Investment Grade Corporate Bond (LQD) prices both advanced.
Silver (SILVER) and Gold (GOLD) advanced.
Crude Oil (CRUDEOIL1!) declined.
Timber (Wood) advanced.
Copper (COPPER1!) and Aluminum (ALI1!) declined.
Bitcoin (BTCUSD) advanced +0.86%. Ethereum (ETHUSD) advanced +3.55%. (Time of writing)
-=x=-=x=-=x=-=x=-=x=-=x=-=x=-
Investor Sentiment
The put/call ratio rose to 0.630. The put/call ratio (PCCE) is a contrarian indicator that shows overly bullish or overly bearish investor behavior. The 0.7 level is considered normal. Below that level is overly bullish.
The CNN Fear & Greed index is moving more into the fear side.
-=x=-=x=-=x=-=x=-=x=-=x=-=x=-
Market Leaders
Apple (AAPL) hit the headlines with a +2.41% advance after JP Morgan upgraded the price target for the stock. Alphabet (GOOGL) rose +0.70%. Microsoft (MSFT) gained +0.54%. Amazon (AMZN) advanced +0.12%.
Apple was the top mega-cap. Coca-Cola (KO) was a surprise second, perhaps getting some positive impact from Pepsi's stellar earnings report the previous day. MasterCard (M) and Visa (V) were third and fourth in the mega-cap list. At the bottom of the list were Nvidia (NVDA), Exxon Mobil (XOM), Tesla (TSLA), and Bank of America (BAC).
Other than the excitement with big tech, it was another dismal day for growth stocks in the daily update list. Twitter (TWTR), Alibaba (BABA), ServiceNow (NOW), and D.R. Horton (DHI) were the only gainers in the list (it is not an exhaustive list of growth stocks). Upwork (UPWK) fell -17.38%. Since May, the stock nearly doubled, and it seems investors were taking profits as the broader market pulled back. GrowGeneration (GRWG) also dropped, declining -11.10%. Solar Edge (SEDG) and UP Fintech (TIGR) round out the bottom four in the growth list.
-=x=-=x=-=x=-=x=-=x=-=x=-=x=-
Looking ahead
Two sets of data will be in focus on Thursday. First, the weekly Initial Jobless Claims will show how the labor market is progressing. Second, the Manufacturing and Industrial Production data in the morning will be closely watched as investors continue to measure the speed of the economic recovery. Jerome Powell will continue testimony in front of Congress in the morning.
Taiwan Semiconductor (TSM) will release earnings on Thursday. The earnings release and commentary should show how stretched the semiconductor giant is to meet demand. The impact may be among auto manufacturers who've had to put plants on hold, waiting for chips from suppliers. Other large producers of electronics will also be impacted.
In addition, UnitedHealth (UNH), Morgan Stanley (MS), U.S. Bancorp (USB), Progressive (PGR), and Cintas (CTAS) will be interesting reports to watch out for on Thursday.
-=x=-=x=-=x=-=x=-=x=-=x=-=x=-
Trends, Support, and Resistance
I marked a support area for the Nasdaq around 14,675 yesterday. The index dropped below that today, but there is still a case for support in the range of 14,645 - 14,675. If a further decline comes tomorrow, I'll remove that support area as it isn't holding.
The trend line from the 5/12 low shows a +1.36% gain for Thursday.
The five-day trend line leads to a +1.11% gain.
The one-day trend line points to a -0.68% loss.
-=x=-=x=-=x=-=x=-=x=-=x=-=x=-
Wrap-up
You are not alone. If you feel like your portfolio is moving lower while the indexes march higher, you've got many friends. Mega-caps are stealing the show right now and sending the major indexes higher while the market continues to weaken underneath them.
The expectation will remain for a move Lower tomorrow. Some good economic news could be enough to start the rally again, but a rally will only have strength with higher volume and an advance/decline ratio above 1.0.
Stay healthy and trade safe!


IXIC: Giving us another TA class! Many patterns around!Hello traders and investors! Let’s see how the Nasdaq is doing today!
It didn’t trigger any pullback sign since our last analysis, and as we thought, it is just trending. I see nothing around telling me it’ll drop again, but we have some possible patterns that could cause a pullback here.
First, notice the purple trendline . We talked about this line last week, when the price was still under it, and once defeated, the market did a pullback and found a support at it. This is another classic example of the Principle of Polarity in Technical Analysis: Previous resistances/supports will work as supports/resistances in the future. This happens because the market has a memory, therefore, we have key points we can use.
What’s more, we have a possible H&S chart pattern , and if we trigger the neckline, by losing the 14,660, then we might see a correction ahead.
The daily chart suggests we could drop to the 21 ema, and that would be fine, the trend would still be bullish in the mid-term. If we fail again in closing above the 14,755 then I believe it’ll be an exhaustion sign for real.
The chart looks quite stretched and this makes traders and investors nervous about buying at a possible top level. What’s the solution? Pick amazing stocks that are already near their support levels. I can’t even count how many incredible opportunities are out there, we just need to know where to look.
Meanwhile, watch the points mentioned in this analysis carefully! If you liked this analysis, remember to follow me to keep in touch with my free daily studies, and support this idea if it helped you!
Thank you very much!

Daily Market Update for 7/13Summary: Higher than expected inflation data wasn't enough to keep the indexes from making new highs, but the rally couldn't last, and markets closed lower on Tuesday. A weaker than expected 30y bond auction sent yields higher and spooked investors in the afternoon. Big tech held onto gains, helping the Technology sector end the day in the positive.
Notes
Ideas always welcome in the comments. Errors will be amended as comments on TradingView or corrected inline in my blog.
-=x=-=x=-=x=-=x=-=x=-=x=-=x=-
Tuesday, July 13, 2021
Facts: -0.38%, Volume higher, Closing range: 12%, Body: 26%
Good: Higher high, outside day that keeps index in uptrend, support at ~14,675
Bad: Long upper wick from afternoon selling, red body at bottom of candle
Highs/Lows: Higher high, lower low
Candle: Outside day, long upper wick signals a bearish reversal day
Advanced/Decline: 0.21, five decline stocks for every advancing stock
Indexes: SPX (-0.35%), DJI (-0.31%), RUT (-1.88%), VIX (+5.88%)
Sectors: Technology (XLK +0.41%) and Consumer Staples (XLP -0.03%) at the top. Consumer Discretionary (XLY -1.20%) and Real Estate (XLRE -1.30%) were the bottom.
Expectation: Lower
-=x=-=x=-=x=-=x=-=x=-=x=-=x=-
Market Overview
Higher than expected inflation data wasn't enough to keep the indexes from making new highs, but the rally couldn't last, and markets closed lower on Tuesday. A weaker than expected 30y bond auction sent yields higher and spooked investors in the afternoon. Big tech held onto gains, helping the Technology sector end the day in the positive.
The Nasdaq closed the day with a -0.38% loss on higher volume. The candle has a long upper wick that represents the morning rally which turned into an afternoon sell-off. The 26% red body sits at the bottom of the candle, creating a 12% closing range above a short lower wick. The outside day with a bearish reversal confirms the underlying weakness where five stocks declined for every advancing stock.
The Dow Jones Industrial Average (DJI) declined -0.31% for the day. The S&P 500 (SPX) lost -0.35%. Small caps were hit the worst, with the Russell 2000 (RUT) dropping -1.88%.
The VIX volatility index rose +5.88%.
Technology (XLK +0.41%) was the only sector to end the day with gains. Consumer Staples (XLP -0.03%) was the second-best sector in the list. Consumer Discretionary (XLY -1.20%) and Real Estate (XLRE -1.30%) were the worst-performing. Despite great earnings reports, the outlook for big banks was not spectacular, sending the Financial sector (XLF -1.08%) lower.
-=x=-=x=-=x=-=x=-=x=-=x=-=x=-
Economic Indicators
The US Dollar (DXY) advanced +0.60% for the day.
The US 30y, 10y, and 2y Treasury yields advanced for the day, and the gap between long-term and short-term yields widened. The 30y auction that occurred today was weaker than expected.
High Yield Corporate Bond (HYG) and Investment Grade Corporate Bond (LQD) prices declined significantly from recent highs.
Silver (SILVER) declined while Gold (GOLD) advanced.
Crude Oil (CRUDEOIL1!) advanced.
Timber (Wood) declined.
Copper (COPPER1!) declined while Aluminum (ALI1!) advanced.
Bitcoin (BTCUSD) declined -1.51%. Ethereum (ETHUSD) declined -4.94%. (Time of writing)
-=x=-=x=-=x=-=x=-=x=-=x=-=x=-
Investor Sentiment
The put/call ratio declined to 0.598. The put/call ratio (PCCE) is a contrarian indicator that shows overly bullish or overly bearish investor behavior. The 0.7 level is considered normal. Below that level is overly bullish.
The CNN Fear & Greed index is on the fear side.
-=x=-=x=-=x=-=x=-=x=-=x=-=x=-
Market Leaders
Of the four largest mega-caps, only Amazon (AMZN) declined today, losing -1.11%. The others ended the day with gains and record closes but could not hold onto intraday highs. Microsoft (MSFT) rose +1.32%. Apple (AAPL) gained +0.79%. Alphabet (GOOGL) advanced +0.29%.
PepsiCo (PEP) topped the mega-cap list after pleasing investors with a great earnings report and raised forecast. Mastercard (MA), Alibaba (BABA), and Visa (V) make up the rest of the top four mega-caps for today. Tesla (TSLA) gave back much of yesterday's gains, ending today at the bottom of the list. Bank of America (BAC) and JP Morgan (JPM) were also at the bottom of the list despite JP Morgan releasing a great earnings report. Watch to see how the market responds to JPM over the next few days to signal how earnings season will go for this quarter.
It was not a great day for growth stocks, but there were some winners in the daily update list. Upwork (UPWK) gained over 5% and topped the list. JD.Com (JD), Alibaba (BABA) were number two and three as Chinese stocks began to climb back from the sell-off last week. Okta (OKTA) was the fourth-best growth stock on the list. The biggest losers were Etsy (ETSY), Penn National Gaming (PENN), Sumo Digital (SUMO), and Lemonade (LMND).
-=x=-=x=-=x=-=x=-=x=-=x=-=x=-
Looking ahead
The producer price index data released on Wednesday will compliment Tuesday's consumer numbers. The produce prices show a leading indicator of inflation before it passes along to consumers. Jerome Powell is going before congress again to talk monetary policy. Play the suspense music here.
Bank of America (BAC), Wells Fargo (WFC), Citigroup (C ), BlackRock (BLK) are among the big finance companies reporting earnings before the market opens. Delta Airlines (DAL) will also be a critical earnings release to watch and measure how airlines are recovering as the economy reopened further this past quarter.
-=x=-=x=-=x=-=x=-=x=-=x=-=x=-
Trends, Support, and Resistance
The Nasdaq set a new all-time high for a second day but could not hold the level, closing lower for the day. It seems there is support around 14,675, which we'll look to hold in tomorrow's session.
The trend line from the 5/12 low shows a +0.94% gain for Wednesday.
The five-day trend line leads to a +0.71% gain.
The one-day trend line points to a -0.53% loss.
-=x=-=x=-=x=-=x=-=x=-=x=-=x=-
Wrap-up
It was a surprise to see the indexes rally after inflation data was higher than expected. The weak 30y bond auction was enough to reverse the positive sentiment and send indexes lower. Tomorrow's producer price index data will add to the story, providing a heads up for more or less inflation coming down the road.
Positive earnings reports for big banks didn't seem to matter today, but we'll see how investors respond to the sector over the next few days. The initial reaction may reverse, and we could see the sector go higher. That would be a positive sign for the next wave of earnings reports in the following weeks.
Stay healthy and trade safe!

Daily Market Update for 7/12Summary: New all-time highs across three of the major indexes is not a bad way to start the week. The 10-year Treasury note auction passed without many surprises, giving the indexes a boost in the afternoon.
Notes
Ideas always welcome in the comments. Errors will be amended as comments on TradingView or corrected inline in my blog.
-=x=-=x=-=x=-=x=-=x=-=x=-=x=-
Monday, July 12, 2021
Facts: +0.21%, Volume higher, Closing range: 69%, Body: 12%
Good: Higher high, higher low, body and closing range in upper half of candle
Bad: Red body, low advance/decline ratio
Highs/Lows: Higher high, higher low
Candle: Thin red body in upper half of the candle, long lower wick from morning dip
Advanced/Decline: 0.8, more declining stocks than advancing stocks
Indexes: SPX (+0.35%), DJI (+0.36%), RUT (+0.08%), VIX (-0.06%)
Sectors: Financials (XLF +0.98%) and Real Estate (XLRE +0.87%) at the top. Energy (XLE -0.15%) and Consumer Staples (XPL -0.16%) were the bottom.
Expectation: Sideways or Higher
-=x=-=x=-=x=-=x=-=x=-=x=-=x=-
Market Overview
New all-time highs across three of the major indexes is not a bad way to start the week. The 10-year Treasury note auction passed without many surprises, giving the indexes a boost in the afternoon.
The Nasdaq closed with a +0.21% advance on slightly higher volume. The candle shows a bit of indecision as markets dipped in the morning but then recovered and made gains in the afternoon after the auction. The 12% Red body in the upper half of the candle is above a long lower wick. The closing range is 69%. There were more declining stocks than advancing stocks.
The Dow Jones Industrial Average (DJI) performed the best for the day with a +0.36% advance. The S&P 500 (SPX) gained +0.35%. The Russell 2000 (RUT) opened the day with a loss but climbed back to end with a +0.08% gain.
The VIX volatility index declined -0.06%.
Financials (XLF +0.98%) and Real Estate (XLRE +0.87%) were at the top of the sector list. Financials is kicking off a big earnings week that will be watched closely by investors. Expect investors to focus on guidance as much or more than they do the results. There were only two declining sectors, Energy (XLE -0.15%) and Consumer Staples (XPL -0.16%).
-=x=-=x=-=x=-=x=-=x=-=x=-=x=-
Economic Indicators
The US Dollar (DXY) advanced +0.13% for the day.
The US 30y and 10y Treasury yields advanced for the day following the 10y note auction. The 2y Treasury yield also all advanced.
High Yield Corporate Bond (HYG) and Investment Grade Corporate Bond (LQD) prices declined.
Silver (SILVER) advanced while Gold (GOLD) declined.h
Crude Oil (CRUDEOIL1!) declined.
Timber (Wood) declined.
Copper (COPPER1!) and Aluminum (ALI1!) declined.
Bitcoin (BTCUSD) declined -3.37%. Ethereum (ETHUSD) declined -4.87%.
-=x=-=x=-=x=-=x=-=x=-=x=-=x=-
Investor Sentiment
The put/call ratio declined to 0.637. The put/call ratio (PCCE) is a contrarian indicator that shows overly bullish or overly bearish investor behavior. The 0.7 level is considered normal. Below that level is overly bullish.
The CNN Fear & Greed index is moving toward neutral.
-=x=-=x=-=x=-=x=-=x=-=x=-=x=-
Market Leaders
Of the four largest mega-caps, only Alphabet (GOOGL) advanced for today, gaining +1.16%. Apple (AAPL) declined -0.42%. Microsoft (MSFT) fell -0.22%. Amazon (AMZN) declined just -0.02%. All four are trading above moving average lines.
Tesla (TSLA) and Walt Disney (DIS) were the top mega-caps for the day, both gaining more than 4%. ASML Holding (ASML) and Nvidia (NVDA) round out the top four. At the bottom of the list are Cisco Systems (CSCO), Salesforce.com (CRM), Abbott Laboratories (ABT), and Oracle (ORCL).
Tesla and Nvidia also top the daily update growth list. Joining them in the top four are Peloton (PTON) and NIO (NIO). At the bottom of the list are Fiverr (FVRR), UP Fintech (TIGR), Fastly (FSLY), and Pinterest (PINS).
-=x=-=x=-=x=-=x=-=x=-=x=-=x=-
Looking ahead
On Tuesday, investors will get a fresh look at the consumer price index data. It's likely to continue showing higher inflation in general. Compare the total CPI number to the Core CPI, which excludes Fuel and Food. Investors will also look closely at what subcomponents drive inflation and how transitory prices will be in those areas.
Weekly API Crude Oil numbers will be available in the afternoon after the market closes.
JP Morgan (JPM) and Goldman Sachs (GS) will kick-off earnings season with pre-market earnings reports. PepsiCo (PEP) will also release earnings in the morning. Another potentially interesting report to watch is Fastenal (FAST) wholesale distributor. Look for signs of more stress or relief in the supply chain.
-=x=-=x=-=x=-=x=-=x=-=x=-=x=-
Trends, Support, and Resistance
The Nasdaq set a new all-time high but could not hold the level, closing slightly lower.
The trend line from the 5/12 low shows a +0.34% gain for Tuesday.
The one-day trend line points to a +0.06% gain.
The five-day trend line leads to a -0.19% loss.
-=x=-=x=-=x=-=x=-=x=-=x=-=x=-
Wrap-up
Today's 10y note auction went by without any big surprises. We seem to be past the volatility in Treasure Yields that happened last week.
Now all eyes turn toward the first earnings reports from big banks tomorrow morning. Investors will also react to any surprises with the Consumer Price Index data released before the market opens.
Stay healthy and trade safe!

Market Week in Review - 7/6/2021 - 7/9/2021Summary: This week's uncertainty around how fast the economy is recovering drove volatility in cyclical sectors while sending Treasury yields on a slide that exasperated investors' worries. Still, the major indexes narrowly secured gains for the week while the S&P 500 and Dow Jones Industrial Average (DJI) set new records.
Notes
The Market Week in Review is my weekend homework where I look over what happened in the previous week and what might come in the next week.
I occasionally have some errors or typos and will correct them in my blog or the comments on TradingView. I do not have an editor and do this in my free time.
If you find this helpful, please let me know in the comments. I am also more than happy to add new perspectives and data points if you have ideas.
The structure is the following:
A recap of the daily updates that I do here on TradingView.
View on the past week
What's coming in the next week
The Bullish View, The Bearish View
Key index levels to watch out for
Wrap-up
If you have been following my daily updates, you can skip down to "View on the Week." If not, then this first part is a great play-by-play recap for the week. Click the daily charts for more detail on sectors, indexes, and market leaders each day.
-=x=-=x=-=x=-=x=-=x=-=x=-=x=-
Tuesday, July 6, 2021
Facts: +0.17%, Volume higher, Closing range: 85%, Body: 1%
Good: High closing range, long lower wick shows recovery from dip
Bad: Volatile outside day with doji star candle, bearish pattern
Highs/Lows: Higher high, lower low
Candle: Doji star candle with longer lower wick, outside day
Advanced/Decline: 0.3, more than three declining stocks for every advancing stock
Indexes: SPX (-0.20%), DJI (-0.60%), RUT (-1.36%), VIX (+9.08%)
Sectors: Real Estate (XLRE +0.89%) and Utilities (XLU +0.42%) at the top. Financials (XLF -1.75%) and Energy (XLE -3.25%) were at the bottom.
Expectation: Sideways or Lower
It was a roller-coaster day for the market as prices dipped in the morning and recovered in the afternoon. Investors reacted to the Purchasing Managers index data that indicates the economic recovery may be slowing. Although the Nasdaq could finish the day with a small gain, most stocks across the index declined for the day.
The Nasdaq closed with a +0.17% gain, beginning the day with a gap at open but quickly selling off in the morning. Eventually, the bulls came in and brought the index back just above where it opened. The volume was higher than the previous day, and the mid-day reversal ended with a high 85% closing range. The close, being just above the open, created a slim 1% body. The outside day, doji star candle signals a bearish reversal pattern. Despite the gain in the index, there were more than three declining stocks for every advancing stock.
-=x=-=x=-=x=-=x=-=x=-=x=-=x=-
Wednesday, July 7, 2021
Facts: +0.01%, Volume higher, Closing range: 28%, Body: 51%
Good: Higher high, higher low
Bad: Couldn't hold morning high, low A/D ratio
Highs/Lows: Higher high, higher low
Candle: Large red body with no upper wick, lower wick created from a morning dip
Advanced/Decline: 0.33, three declining stocks for every advancing stock
Indexes: SPX (+0.34%), DJI (+0.30%), RUT (-0.95%), VIX (-1.46%)
Sectors: Materials (XLB +1.04%) and Industrials (XLI +1.00%) at the top. Communications (XLC -0.15%) and Energy (XLE -1.63%) were at the bottom.
Expectation: Sideways or Lower
Investors rotated back to cyclical stocks after they underperformed yesterday. Mega-caps also did well on a day with no huge surprises in economic news. Jobs data was a bit lower than expected, but not bad, and there were no unexpected statements in the Fed minutes.
The Nasdaq ended the day with a +0.01% gain, carried mainly by mega-caps. There continues to be a much higher number of declining stocks than advancing stocks, with a ratio of 3 to 1 today. The closing range of 28% follows a morning gap-up that quickly sold off to create a long lower wick. The index recovered some of the loss, leaving a 51% red body over the long lower wick.
-=x=-=x=-=x=-=x=-=x=-=x=-=x=-
Thursday, July 8, 2021
Facts: -0.72%, Volume lower, Closing range: 79%, Body: 63%
Good: Closed above 14,500 support area, lower volume on down day
Bad: Gap down at open, lower high, lower low
Highs/Lows: Lower high, lower low
Candle: Large green body in the middle of two short wicks, the upper wick is slightly longer
Advanced/Decline: 0.37, nearly three declining stocks for every advancing stock
Indexes: SPX (-0.86%), DJI (-0.75%), RUT (-0.94%), VIX (+17.27%)
Sectors: Real Estate (XLRE -0.09%) and Consumer Discretionary (XLY -0.25%) at the top. Industrials (XLI -1.29%) and Financials (XLF -2.00%) were bottom.
Expectation: Sideways or Lower
Is it a pullback from a new high and or the start of a more significant correction? You won't find any easy answers in the data. A few weeks ago, investors were worried about an overheating economic recovery, and now they seem worried about a slowing recovery.
The Nasdaq closed with a -0.72% decline on lower volume. The gap-down at open looked severe and dropped the index below the 14,500 support area, but a mid-day rally brought it back above the support line. The rally created a 63% green body. Prices faded in the late afternoon to create an upper wick and finish the day with a 79% closing range. The lower high and lower low combination is the first in several weeks of gains. The advance/decline line remains low, with almost three declining stocks for every advancing stock.
-=x=-=x=-=x=-=x=-=x=-=x=-=x=-
Friday, July 9, 2021
Facts: +0.98%, Volume lower, Closing range: 78%, Body: 98%
Good: Close above the weekly open, high closing range, A/D ratio
Bad: Lower volume
Highs/Lows: Higher high, higher low
Candle: Mostly green body, slightly longer lower wick
Advanced/Decline: 2.51, five advancing stocks for every two declining stocks
Indexes: SPX (+1.13%), DJI (+1.30%), RUT (+2.17%), VIX (-14.94%)
Sectors: Financials (XLF +2.89%) and Energy (XLE +2.13%) at the top. Health (XLV +0.34%) and Utilities (XLU +0.12%) were bottom.
Expectation: Higher
Friday brought a confident end to a short but volatile week. After the bond yield slide caused a sell-off the previous day, yields recovered, and investors moved back into equities. In contrast to Thursday, all sectors closed with gains on Friday.
The Nasdaq closed with a +0.98% advance, with gains broadly shared across the index. There were five advancing stocks for every declining stock. The only thing missing was the volume which was much lower than the previous day. Nonetheless, the high closing range of 95% and the green body that spans 78% of the candle are bullish. It also helps close the week with a positive weekly gain.
-=x=-=x=-=x=-=x=-=x=-=x=-=x=-
View on the Week
This week's uncertainty around how fast the economy is recovering drove volatility in cyclical sectors while sending Treasury yields on a slide that exasperated investors' worries. Still, the major indexes narrowly secured gains for the week while the S&P 500 and Dow Jones Industrial Average (DJI) set new records.
The week opened with investors taking defensive positions in Real Estate and Utilities, showing nervousness over new developments in the pandemic. Among recent surges in the number of cases identified as the Delta variant, Pfizer added worries that the vaccinated population might require a six-month booster shot to remain safe.
In a demonstration of just how confused investors are about economic data, cyclical sectors sold off on Tuesday, were repurchased on Wednesday, sold off again on Thursday, and bought back on Friday. Despite gains on the first two days, the number of declining stocks outnumbered advancing stocks 3 to 1 most of the week. The increases in the indexes for the first three days were driven primarily by mega-caps.
The most significant sign of change in investors thinking was in the sliding yields for Treasury notes. Yields have been dropping since economic data started to show the recovery is progressing slower than previously expected. Never mind that the economy is still expanding at a historically high rate and inflation continues to be a concern. Analysts needed to recalculate and rebalance for the new speed.
The slide in yields came to a critical moment on Thursday when investors who were betting that yields would rise needed to cover those positions. Bond yields move in the opposite direction of prices. Investors were expecting yields to go up, and prices to go down and took short positions in those bonds. When the opposite happened, they needed to buy back the bonds to cover the short position. The result was even higher prices and lower yields.
Once bond investors covered those positions, we saw a recovery of yields on Friday and a boost in equities as investors came back into the market. The story is not over yet. There were more advancing stocks than declining stocks on Friday, but volume in the market was meager.
The Nasdaq advanced +0.43% this week. Volume was slightly higher than the previous week but lower than average for this year. The low is lower than the last week, and the high is higher, marking an outside week for the index. The closing range of 86% is healthy. The long lower wick represents the dip on Thursday that was bought on Friday.
The S&P 500 (SPX) closed the week at another record, advancing +0.40% for the week. The Dow Jones Industrial Average (DJI) also had a record close with a +0.24% gain for the week. The picture was not quite as rosy for small caps, with the Russell 2000 (RUT) declining most of the week. The index gained on Friday, but not enough to end the week positively, falling -1.12% for the week.
The VIX volatility advanced +7.23% for the week. It climbed almost 42% intra-week.
The short week was defined mainly by Thursday's sell-off in equities as Treasury bond yields were sliding. That gave a boost to two defensive sectors, Real Estate ( XLRE ) and Utilities ( XLU ), but the two sectors were already leading from Monday. The worries ended on Friday, but the two sectors remained in the lead for the week.
Technology ( XLK ) and Consumer Discretionary ( XLY ) were the next two sectors at the top of the list, showing a mix of risk-on and risk-off sentiment throughout the week.
The cyclical sectors moved from the top of the sector list on Wednesday to the bottom of the list on Thursday, back to the top of the list on Friday.
Energy ( XLE ) was a consistent loser throughout the week until finally finding itself at the top of the list on Friday. However, the gains were not enough to move it out of the bottom position for the week.
Treasury yields on the 30y, 10y, and 2y all declined for the week. The gap between long-term yields and short-term yields continues to close while the yield curve shape is normalizing.
High Yield Corporate Bond (HYG) prices declined slightly but remained near pre-pandemic highs. Investment Grade Bond (LQD) prices advanced.
The US Dollar (DXY) declined -0.15% for the week.
Silver (SILVER) declined -1.36%, and Gold (GOLD) advanced +1.15%.
Crude Oil (CRUDEOIL1!) declined -0.77% after clearing its 2018 high last week and setting a new high on Monday.
Timber (WOOD) advanced +2.44%.
Copper (COPPER1!) advanced +1.33%.
Aluminum (ALI1!) declined -2.48%.
-=x=-=x=-=x=-=x=-=x=-=x=-=x=-
Big Four Mega-caps
Microsoft (MSFT) and Alphabet (GOOGL) signaled indecision among investors with their weekly candles. Despite the uncertainty, Microsoft and Alphabet gained +0.10% and +0.21%, respectively. Apple (AAPL) and Amazon (AMZN) showed very bullish weeks. Amazon gained +5.93%, continuing momentum after the government ended an exclusive contract with Microsoft and opened up opportunities for other cloud vendors. Apple gained +3.68% for the week.
-=x=-=x=-=x=-=x=-=x=-=x=-=x=-
The Four Recovery Stocks
I picked four recovery stocks to track against the indexes and other indicators in this weekly report. Given the worries over the economic recovery and new fears for the pandemic, it's no surprise to see the continued losses in the recovery stocks. Only Marriott (MAR) ended the week with gains, advancing +0.86%. Exxon Mobil (XOM) declined -3.07%. Delta Airlines (DAL) lost -2.79%. Carnival Cruise Lines (CCL) had the most significant decline, falling -6.91%. All four closed the week above their 40-week moving average.
-=x=-=x=-=x=-=x=-=x=-=x=-=x=-
Cryptocurrency
I started tracking four major cryptocurrencies on the week in review. The four are Bitcoin, Ethereum, Litecoin, and Bitcoin Cash. The latter two are not the largest by market cap but seem to be well-known and are part of the CIX capital.com index, tracking five cryptocurrencies, including these four (Ripple is the fifth).
All four cryptocurrencies declined for the week as they consolidate in sideways trends. Volume is shrinking while bases develop. At the time of writing, Bitcoin (BTCUSD) declined -2.60%. Ethereum (ETHUSD) fell -7.55%. Litecoin (LTCUSD) dropped -7.28%. Bitcoin Cash (BCHUSD) declined -5.20%.
-=x=-=x=-=x=-=x=-=x=-=x=-=x=-
Investor Sentiment
The put/call ratio (PCCE) moved higher, ending the week at 0.735. A contrarian indicator, when the put/call ratio is below 0.7, it signals overly bullish sentiment and could mean an overbought market.
The CNN Fear & Greed Index moved further into the fear side mid-week but is on its way back toward neutral.
The NAAIM Exposure Index shows money managers at 82.54 average exposure among active money managers. The survey occurs on Wednesdays, so the number does not include any of the selling on Thursday.
-=x=-=x=-=x=-=x=-=x=-=x=-=x=-
The Week Ahead
The week will start slow, but earnings reports will pick up as Financials kick off the earnings season.
Monday
The USDA will release the monthly agriculture supply and demand estimate report on Monday. Investors will also watch the 10y and 3y note auction closely in the afternoon.
There are no relevant earnings reports for the daily update on Monday.
Tuesday
On Tuesday, investors will get a fresh look at the consumer price index data. It's likely to continue showing higher inflation in general. Compare the total CPI number to the Core CPI, which excludes Fuel and Food. Investors will also look closely at what subcomponents drive inflation and how transitory prices will be in those areas.
Weekly API Crude Oil numbers will be available in the afternoon after the market closes.
JP Morgan (JPM) and Goldman Sachs (GS) will kick-off earnings season with pre-market earnings reports. PepsiCo (PEP) will also release earnings in the morning. Another potentially interesting report to watch is Fastenal (FAST) wholesale distributor. Look for signs of more stress or relief in the supply chain.
Wednesday
The producer price index data released on Wednesday will compliment Tuesday's consumer numbers. The produce prices show a leading indicator of inflation before it passes along to consumers.
Bank of America (BAC), Wells Fargo (WFC), Citigroup (C ), BlackRock (BLK) are among the big finance companies reporting earnings before the market opens. Delta Airlines (DAL) will also be a critical earnings release to watch and measure how airlines are recovering as the economy reopened further this past quarter.
Thursday
Two sets of data will be in focus on Thursday. First, the weekly Initial Jobless Claims will show how the labor market is progressing. Second, the Manufacturing and Industrial Production data in the morning will be closely watched as investors continue to measure the speed of the economic recovery.
Taiwan Semiconductor (TSM) will release earnings on Thursday. The earnings release and commentary should show how stretched the semiconductor giant is to meet demand. The impact may be among auto manufacturers who've had to put plants on hold, waiting for chips from suppliers. Other large producers of electronics will also be impacted.
In addition, UnitedHealth (UNH), Morgan Stanley (MS), U.S. Bancorp (USB), Progressive (PGR), and Cintas (CTAS) will be interesting reports to watch out for on Thursday.
Friday
The focus will be on Retail Sales data on Friday morning. Consumer Sentiment and Consumer Expectations data will be available after the market opens.
Friday's earning reports include Honeywell (HON) and Charles Schwab (SCHW).
-=x=-=x=-=x=-=x=-=x=-=x=-=x=-
The Bullish Side
Sliding Treasury Yields tested investor confidence this past week. The markets largely passed the test as yields recovered and the indexes moved higher. There are some key things we can look to for a bullish outlook.
First, the lowering treasury yields drive borrowing costs lower for companies. The result is that investors are further buying up both Investment Grade Corporate Bonds and High Yield "Junk" Bonds. Although yields on those bonds also drop as prices go up, the yields are higher than government bonds, and the purchases reflect confidence in US businesses to pay back debts.
If inflation is really going to stick, funding growth via cheap debt now could be a smart move by companies. Use the purchasing power now before further inflation hits, and then as inflation continues, the debt obligation becomes cheaper over time. There are plenty of examples in history of wise business owners funding massive growth by acquiring debt in the face of inflation.
-=x=-=x=-=x=-=x=-=x=-=x=-=x=-
The Bearish Side
The indexes are extended as they continue to set new record closes. As uncertainty remains around how quickly the economy is expanding, investors will continue to rotate between sectors and cap segments. The volatility will send a portion of smart money to safer bets elsewhere. The pullback isn't necessarily a bad thing but will undoubtedly be painful for some.
As supply chain pressure remains among higher demand from consumers, inflation will remain a concern. This week's CPI and PPI data may be a crushing blow to investor confidence. Higher than expected numbers will drive more volatility in both bond and equity markets.
-=x=-=x=-=x=-=x=-=x=-=x=-=x=-
Key Nasdaq Levels to Watch
The Nasdaq set another all-time high this week before pulling back on economic worries on Thursday. Still, the index remained above the 21d moving average and continues to track along with a regression trend mid-line from the 5/12 low.
On the positive side, the levels are:
The high of this past week was a new all-time high at 14,755.33.
The mid-point of the regression trend from the 5/12 low points to 14,914 by the end of the week.
The round number 15,000 is likely to be a new area of resistance.
On the downside, there are a few key levels:
The 10d MA is at 14,564.53.
14,500 is a support area developed from three days of sideways trading this week.
The low of this past week is 14,371.59.
The 21d EMA is at 14,363.62.
14,000 has been a key area of support/resistance.
The 50d MA is at 13,926.79.
There is a pivot at 13,548.93. This is a "higher low" in the current uptrend.
There is a support area at 13,000. 13,002.54 is a pivot from May.
13,026.58 is the 200d MA. This could be a support point if the index falls below 13,000.
12,397.05 is a low pivot point from the early March dip.
-=x=-=x=-=x=-=x=-=x=-=x=-=x=-
Wrap-up
The mixed sentiment among investors on the economic recovery is interesting. Yes, the economic recovery is slowing, yet it's still expanding at a higher than standard rate. The Fed's monetary policy seems to be supporting the growth while still allowing room to taper if the recovery drives unacceptable levels of inflation.
That's driving yields lower, bringing borrowing costs down. Small and large companies can borrow at those reduced rates to drive further growth. If inflation continues, the costs to servicing the debt only become cheaper. That to me appears bullish, but maybe I'm a fool.
Only history will be the final judge of who is wise and who is a fool. Follow price!
Good luck, stay healthy, and trade safe!

Daily Market Update for 7/9Summary: Friday brought a confident end to a short but volatile week. After the bond yield slide caused a sell-off the previous day, yields recovered, and investors moved back into equities. In contrast to Thursday, all sectors closed with gains on Friday.
Notes
Ideas always welcome in the comments. Errors will be amended as comments on TradingView or corrected inline in my blog.
-=x=-=x=-=x=-=x=-=x=-=x=-=x=-
Friday, July 9, 2021
Facts: +0.98%, Volume lower, Closing range: 78%, Body: 98%
Good: Close above the weekly open, high closing range, A/D ratio
Bad: Lower volume
Highs/Lows: Higher high, higher low
Candle: Mostly green body, slightly longer lower wick
Advanced/Decline: 2.51, five advancing stocks for every two declining stocks
Indexes: SPX (+1.13%), DJI (+1.30%), RUT (+2.17%), VIX (-14.94%)
Sectors: Financials (XLF +2.89%) and Energy (XLE +2.13%) at the top. Health (XLV +0.34%) and Utilities (XLU +0.12%) were bottom.
Expectation: Higher
-=x=-=x=-=x=-=x=-=x=-=x=-=x=-
Market Overview
Friday brought a confident end to a short but volatile week. After the bond yield slide caused a sell-off the previous day, yields recovered, and investors moved back into equities. In contrast to Thursday, all sectors closed with gains on Friday.
The Nasdaq closed with a +0.98% advance, with gains broadly shared across the index. There were five advancing stocks for every declining stock. The only thing missing was the volume which was much lower than the previous day. Nonetheless, the high closing range of 95% and the green body that spans 78% of the candle are bullish. It also helps close the week with a positive weekly gain.
The Russell 2000 (RUT) performed the best for the day as investors swung back into small caps. The index gained +2.17% but still closed with a weekly loss. The Dow Jones Industrial Average (DJI) and S&P 500 (SPX) soared back to another set of record closes with +1.30% and +1.13% gains today.
The VIX volatility index declined -14.94%.
All sectors gained today, and cyclical sectors moved back to the top of the sector list. Financials (XLF +2.89%) and Energy (XLE +2.13%) were at the top of the list, followed by Materials (XLB +1.97%) and Industrials (XLI +1.58%). Health (XLV +0.34%) and Utilities (XLU +0.12%) were at the bottom of the list, as investors did not take defensive positions heading into the weekend.
-=x=-=x=-=x=-=x=-=x=-=x=-=x=-
Economic Indicators
The US Dollar (DXY) declined -0.27% for the day.
Bond yields recovered from the previous day's drop. The US 30y, 10y, and 2y Treasury yields all advanced.
High Yield Corporate Bond (HYG) prices advanced while Investment Grade Corporate Bond (LQD) prices declined. Both are in an uptrend.
Silver (SILVER) and Gold (GOLD) advanced.
Crude Oil (CRUDEOIL1!) advanced.
Timber (Wood) advanced.
Copper (COPPER1!) and Aluminum (ALI1!) advanced.
Bitcoin (BTCUSD) advanced +2.82%. Ethereum (ETHUSD) advanced +1.50%.
-=x=-=x=-=x=-=x=-=x=-=x=-=x=-
Investor Sentiment
The put/call ratio rose to 0.735. The put/call ratio (PCCE) is a contrarian indicator that shows overly bullish or overly bearish investor behavior. The 0.7 level is considered normal. Below that level is overly bullish.
The CNN Fear & Greed index is on the fear side, moving back toward neutral.
The NAAIM Exposure Index shows money managers at 82.54 average exposure among active money managers. The survey occurs on Wednesdays, so the number does not include any of the selling on Thursday.
-=x=-=x=-=x=-=x=-=x=-=x=-=x=-
Market Leaders
Apple (AAPL) climbed back to all-time highs with a +1.31% advance on Friday. Alphabet (GOOGL) gained +0.38%. Microsoft (MSFT) advanced +0.19%. Amazon (AMZN) was the only of the largest four mega-caps to decline for the day, losing -0.32% but still very extended above moving average lines.
Big banks led the mega-cap list, with Bank of America (BAC) and JP Morgan Chase (JPM) gaining more than 3%. Also in the top four were Alibaba (BABA) and ASML Holding (ASML). At the bottom of the list were Eli Lilly (LLY), Comcast (CMCSA), and Amazon (AMZN). The handful of losers in the mega-cap list all lost less than 1%.
There were also only a handful of losers in the daily update growth list. The top gainers were Snowflake (SNOW), SNAP (SNAP), Chewy (CHWY), and Upwork (UPWK). At the bottom of the list were Peloton (PTON), Zynga (ZNGA), Etsy (ETSY), and DocuSign (DOCU)
-=x=-=x=-=x=-=x=-=x=-=x=-=x=-
Looking ahead
The USDA will release the monthly agriculture supply and demand estimate report on Monday. Investors will also watch the 10y and 3y note auction closely in the afternoon.
There are no relevant earnings reports for the daily update on Monday, but that will change by Tuesday as earnings season kicks off next week.
-=x=-=x=-=x=-=x=-=x=-=x=-=x=-
Trends, Support, and Resistance
The Nasdaq was able to close with a weekly gain, recovering from yesterday's losses. It's in a position to make another new all-time high in the next week if trends continue.
The one-day trend line points to a +0.85% gain for Monday.
The trend line from the 5/12 low shows a +0.30% gain.
The five-day trend line leads to a -0.45% loss to start the week.
-=x=-=x=-=x=-=x=-=x=-=x=-=x=-
Wrap-up
After a "the sky is falling" moment with bond yields on Thursday, everything seemed to be back to normal on Friday. The thesis that bond traders were covering for short positions seemed to be correct. The performance of the treasury note auctions on Monday afternoon will be a better signal of the health of the bond market.
Based on the two thick-bodied, green candles on Thursday and Friday, the expectation is for Higher on Monday.
Stay healthy and trade safe!

The Nasdaq or the Fed Balance Sheet..❔Since 2008 the Federal Reserve balance sheet has increased steadily from $ 870 billion to 4 trillion USD. In the last year, it has doubled again to $ 8 trillion. This suggests that the FED has printed more DOLLARS in the last year than it has in the previous 100. The Nasdaq has experienced a similar growth cycle over thae same period; strange that...

NASDAQ Overall View. We're at wave 3 (yellow). 10/July/21 NASDAQ Overall perspective, Index price probably at wave 3 (yellow) which is not completed yet.
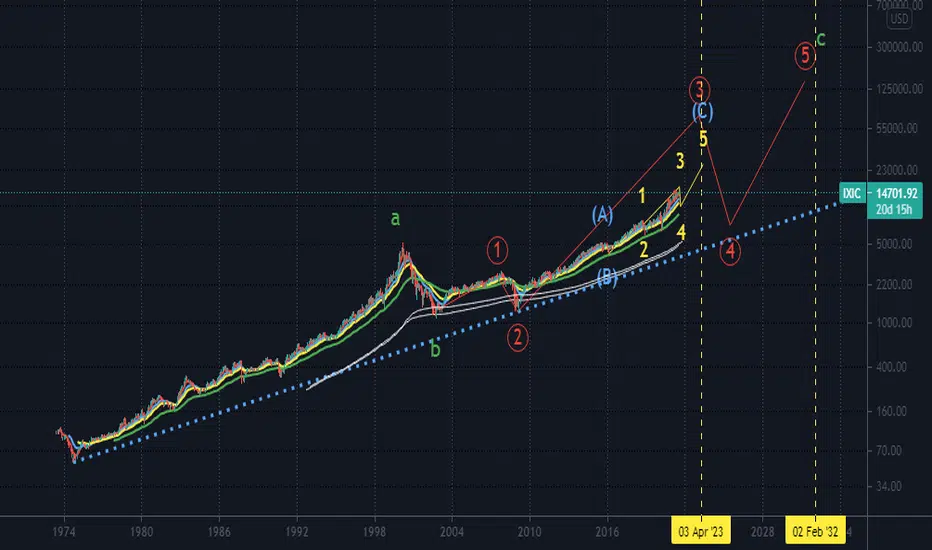
New Bubble in developmentExpecting it ends in late 2021. It seems it is safe to invest in NASDAQ:NDAQ for now because we are in the middle of the bubble, but as more and more "investors" from Robinhood is coming at the market as more bubbling we see. And eventually, the bubble will brakes. Together with the recession scenario and low-interest rates this is likely to happen someday in 2021

IXIC: Be careful with these points! Time to buy or sell?Hello traders and investors! Let’s see how the NDX is doing today!
The index crashed a little this week, which is fine, but I find it curious that some people panic over just a 2% correction. The key is to have balance, and to know where to buy/sell.
Now it is not the time to buy Nasdaq, but I don’t think it is time to sell it either. The trend is clearly bullish , and let’s not forget Dow Theory 5th tenet: Trends persist until a clear reversal occurs . As long as we don’t see a clear reversal, all we can assume is that it’ll keep pushing up.
What would be an alarming sign? If the index loses the 14,511 (black line), after failing in defeating the purple trendline. We may drop to the 21 ema, or even a little bit below this point, and do some sideways movements for the next few days, but not lose the 14,511, as this will indicate exhaustion.
The daily chart suggests that a pullback to the 21 ema is plausible, but for now, we have no pullback signs around. The moment to buy was around May, when my followers and I bought many stocks, like PLTR, PINS, MSFT, AAPL, ARKK and many others at their dips . Now it is time to manage positions.
Now the amount of stocks trading at a discount is limited (there are still a lot there, if you know where to look), and if you want to trade, do it with caution. I’m neutral on Nasdaq, but still see some opportunities around.
Let’s watch these points and we’ll be just fine. Remember to follow me to keep in touch with my daily studies, and support this idea if it helped you!
Have a good weekend!


Daily Market Update for 7/8Summary: Is it a pullback from a new high and or the start of a more significant correction? You won't find any easy answers in the data. A few weeks ago, investors were worried about an overheating economic recovery, and now they seem worried about a slowing recovery.
Notes
Ideas always welcome in the comments. Errors will be amended as comments on TradingView or corrected inline in my blog.
-=x=-=x=-=x=-=x=-=x=-=x=-=x=-
Thursday, July 8, 2021
Facts: -0.72%, Volume lower, Closing range: 79%, Body: 63%
Good: Closed above 14,500 support area, lower volume on down day
Bad: Gap down at open, lower high, lower low
Highs/Lows: Lower high, lower low
Candle: Large green body in the middle of two short wicks, the upper wick is slightly longer
Advanced/Decline: 0.37, nearly three declining stocks for every advancing stock
Indexes: SPX (-0.86%), DJI (-0.75%), RUT (-0.94%), VIX (+17.27%)
Sectors: Real Estate (XLRE -0.09%) and Consumer Discretionary (XLY -0.25%) at the top. Industrials (XLI -1.29%) and Financials (XLF -2.00%) were bottom.
Expectation: Sideways or Lower
-=x=-=x=-=x=-=x=-=x=-=x=-=x=-
Market Overview
Is it a pullback from a new high and or the start of a more significant correction? You won't find any easy answers in the data. A few weeks ago, investors were worried about an overheating economic recovery, and now they seem worried about a slowing recovery.
The Nasdaq closed with a -0.72% decline on lower volume. The gap-down at open looked severe and dropped the index below the 14,500 support area, but a mid-day rally brought it back above the support line. The rally created a 63% green body. Prices faded in the late afternoon to create an upper wick and finish the day with a 79% closing range. The lower high and lower low combination is the first in several weeks of gains. The advance/decline line remains low, with almost three declining stocks for every advancing stock.
The S&P 500 (SPX) declined -0.86%, recovering after nearly dropping below its 21d EMA. The Dow Jones Industrial Average (DJI) fell -0.75%. The Russell 2000 (RUT) seems to be in the most trouble, with a decline of -0.94% today.
The VIX volatility index soared +17.27%.
All sectors lost ground today, and cyclical sectors moved back to the bottom of the sector list. Real Estate (XLRE -0.09%), Consumer Discretionary (XLY -0.25%), and Utilities (XLU -0.29%) were at the top of the list.
Industrials (XLI -1.29%) and Financials (XLF -2.00%) were at the bottom.
-=x=-=x=-=x=-=x=-=x=-=x=-=x=-
Economic Indicators
The US Dollar (DXY) declined -0.37% for the day.
The big news today was the continued slide of government bond yields worldwide. The US 30y, 10y, and 2y Treasury yields continue to decline as the gap between long-term and short-term yields tighten.
High Yield Corporate Bond (HYG) and Investment Grade Corporate Bond (LQD) prices advanced.
Silver (SILVER) and Gold (GOLD) declined.
Crude Oil (CRUDEOIL1!) advanced slightly.
Timber (Wood) declined.
Copper (COPPER1!) and Aluminum (ALI1!) declined.
Bitcoin (BTCUSD) declined -3.26%. Ethereum (ETHUSD) declined -8.38%. (Time of writing)
-=x=-=x=-=x=-=x=-=x=-=x=-=x=-
Investor Sentiment
The put/call ratio rose to 0.665. The put/call ratio (PCCE) is a contrarian indicator that shows overly bullish or overly bearish investor behavior. The 0.7 level is considered normal. Below that level is overly bullish.
The CNN Fear & Greed index is moved much further to the fear side.
The NAAIM Exposure Index shows money managers at 82.54 average exposure among active money managers. The survey occurs on Wednesdays, so the number does not include any of the selling on Thursday.
-=x=-=x=-=x=-=x=-=x=-=x=-=x=-
Market Leaders
Amazon (AMZN) gained +0.94% today, helping the Consumer Discretionary sector to remain high in the sector list. The other three largest mega-caps declined but remain extended above moving average lines. Alphabet (GOOGL) is the closest to its moving average lines, falling -1.13% today. Apple (AAPL) pulled back -0.92% after several days of rally. Microsoft (MSFT) is also pulling back from a new all-time high, losing -0.90% today.
Only a handful of mega-caps gained today. Tesla (TSLA), Amazon (AMZN), Eli Lilly (LLY), and Novartis AG (NVS) topped the mega-cap list. Alibaba (BABA) the worst-performing in the list as Chinese stocks continue to sell-off. AT&T (T), Bank of America (BAC), and ASML Holding (ASML) were others at the bottom of the list.
The daily update growth list also had more losers than gainers. The most significant gains included Etsy (ETSY), Penn National Gaming (PENN), Fastly (FSLY), and Tesla (TSLA). Alibaba (BABA), FUTU Holding (FUTU), D.R. Horton (DHI), and SNAP (SNAP) were at the bottom of the list.
-=x=-=x=-=x=-=x=-=x=-=x=-=x=-
Looking ahead
The Fed will release its semi-annual Monetary Policy Report on Friday.
There are no relevant earnings reports for the daily update on Friday.
-=x=-=x=-=x=-=x=-=x=-=x=-=x=-
Trends, Support, and Resistance
The Nasdaq opened below the 14,500 support area this morning. It rallied back above the level by the end of the day. In the morning volatility, 14,425 also emerged as an area of support.
The one-day trend lien points to a +1.15%, which would continue the recovery from today's low at market open. The trend line from the 5/12 low is just below that target.
The five-day trend line leads to a +0.50% gain for tomorrow.
There's still potential for a further pullback, so I added a trend-line that follows from yesterday's high and ends with a -0.95% loss for tomorrow.
-=x=-=x=-=x=-=x=-=x=-=x=-=x=-
Wrap-up
Attention was on sliding government bond yields today.
The slide in long-term yields typically indicates less confidence in future economic growth. But as with most economic indicators this year, there may be more to the story.
Some argue that investors were heavily shorting bond prices (prices move in the opposite direction of yields). They expected yields to rise as the economy continues to overheat and people dump the bonds to find inflation-protected gains elsewhere. Recent economic data showed a slower than expected recovery and caused the trade to go against them. The resulting purchases to cover short positions sent yields even lower.
As we saw earlier in the year, volatility in bonds will cause volatility in equities as well. So over the next few days, we will watch to see if investors are correcting for a change in the pace of the recovery or are more severe fears about the future driving the behavior.
With the lower high and lower low, the expectation for tomorrow remains sideways or lower.
Stay healthy and trade safe!

Nasdaq - High Reward Short SetupHigh probability trade for very fast gains this week.
You'll know if it's on by end of day; would get in short soon and leave a very loose stop.
TVC:IXIC
TVC:NDX
CURRENCYCOM:US100

Where is the MOST probable support I think the correction could be between 3-6% in the next few weeks.

Daily Market Update for 7/7Summary: Investors rotated back to cyclical stocks after they underperformed yesterday. Mega-caps also did well on a day with no huge surprises in economic news. Jobs data was a bit lower than expected, but not bad, and there were no unexpected statements in the Fed minutes.
Notes
Ideas always welcome in the comments. Errors will be amended as comments on TradingView or corrected inline in my blog.
-=x=-=x=-=x=-=x=-=x=-=x=-=x=-
Wednesday, July 7, 2021
Facts: +0.01%, Volume higher, Closing range: 28%, Body: 51%
Good: Higher high, higher low
Bad: Couldn't hold morning high, low A/D ratio
Highs/Lows: Higher high, higher low
Candle: Large red body with no upper wick, lower wick created from a morning dip
Advanced/Decline: 0.33, three declining stocks for every advancing stock
Indexes: SPX (+0.34%), DJI (+0.30%), RUT (-0.95%), VIX (-1.46%)
Sectors: Materials (XLB +1.04%) and Industrials (XLI +1.00%) at the top. Communications (XLC -0.15%) and Energy (XLE -1.63%) were at the bottom.
Expectation: Sideways or Lower
-=x=-=x=-=x=-=x=-=x=-=x=-=x=-
Market Overview
Investors rotated back to cyclical stocks after they underperformed yesterday. Mega-caps also did well on a day with no huge surprises in economic news. Jobs data was a bit lower than expected, but not bad, and there were no unexpected statements in the Fed minutes.
The Nasdaq ended the day with a +0.01% gain, carried mainly by mega-caps. There continues to be a much higher number of declining stocks than advancing stocks, with a ratio of 3 to 1 today. The closing range of 28% follows a morning gap-up that quickly sold off to create a long lower wick. The index recovered some of the loss, leaving a 51% red body over the long lower wick.
The S&P 500 (SPX) and Dow Jones Industrial Average (DJI) fared better with +0.34% and +0.30% gains today. The Russell 2000 (RUT) declined -0.95%.
The VIX volatility index declined -1.46%.
Cyclical sectors moved back to the top of the sector list, with Materials (XLB +1.04%) and Industrials (XLI +1.00%) leading the day. Communications (XLC -0.15%) and Energy (XLE -1.63%) were at the bottom of today's list.
-=x=-=x=-=x=-=x=-=x=-=x=-=x=-
Economic Indicators
The US Dollar (DXY) advanced +0.17% for the day.
The US 30y, 10y, and 2y Treasury yields continue to decline as the gap between long-term and short-term yields tighten.
High Yield Corporate Bond (HYG) and Investment Grade Corporate Bond (LQD) prices advanced.
Silver (SILVER) remained flat while Gold (GOLD) advanced.
Crude Oil (CRUDEOIL1!) continues to decline off recent highs.
Timber (Wood) advanced.
Copper (COPPER1!) advanced and Aluminum (ALI1!) declined.
Bitcoin (BTCUSD) declined -0.53%. Ethereum (ETHUSD) advanced +0.04%. (Time of writing)
-=x=-=x=-=x=-=x=-=x=-=x=-=x=-
Investor Sentiment
The put/call ratio rose to 0.629. The put/call ratio (PCCE) is a contrarian indicator that shows overly bullish or overly bearish investor behavior. The 0.7 level is considered normal. Below that level is overly bullish.
The CNN Fear & Greed index is on the fear side, moving further from neutral.
-=x=-=x=-=x=-=x=-=x=-=x=-=x=-
Market Leaders
The four largest mega-caps continue to advance with gains today, but the charts start to look overly extended from moving averages.
Apple (AAPL) gained another +1.80% today, setting a record close. Microsoft (MSFT) gained +0.82%. Amazon (AMZN) and Alphabet (GOOGL) had advances but could not hold onto intraday gains, ending the day with +0.57% and +0.23% gains.
Oracle (ORCL) topped the mega-cap list today, with Apple (AAPL), PayPal (PYPL), and Adobe (ADBE) filling out the top four. At the bottom of the list are Exxon Mobile (XOM), Nvidia (NVDA), Alibaba (BABA), and Tesla (TSLA).
The majority of the daily update growth list lost for the day. However, there were several gainers with SUMO Digital (SUMO), Snowflake (SNOW), RH (RH), and D.R. Horton (DHI) topping the list. At the bottom of the list are Lemonade (LMND), GrowGeneration (GRWG), NIO (NIO), and Ehang Holdings (EH).
-=x=-=x=-=x=-=x=-=x=-=x=-=x=-
Looking ahead
Initial Jobless Claims and weekly Crude Oil Inventories data will be available on Thursday.
There are no relevant earnings reports for the daily update on Thursday.
-=x=-=x=-=x=-=x=-=x=-=x=-=x=-
Trends, Support, and Resistance
Just as yesterday, the Nasdaq set a new all-time high after opening but then sold off quickly.
The five-day trend line points to a +0.49% gain for Thursday.
The trend line from the 5/12 low leads to a +0.16% gain.
The one-day trend line is downward sloping and points to a -0.04% decline.
-=x=-=x=-=x=-=x=-=x=-=x=-=x=-
Wrap-up
As rotations go, yesterday's sell-off of cyclical sectors became today's buying opportunity. Big tech mega-caps are mainly driving the gains in the Nasdaq. The advance/decline ratio hasn't been over 1.0 since 6/24.
With increasing volatility in the intraday chart and the advance/decline ratio remaining low, it’s a good time for caution. However, the index continues to ride the mid-point of an upward regression trend channel from 5/12, so more gains could be ahead.
The expectation is set for sideways or lower tomorrow. Surprise me.
Stay healthy and trade safe!
