Lamborger Alerts**📈 MARA Long @ $19.8**
Stop: $17.91 | Target: $24.61 | R:R: 2.55
The technical indicators suggest a positive momentum with RSI at 63.15 indicating a bullish trend without being overbought. The MACD is positive, supporting upward momentum. The ADX at 27.
**Key Factors:** Positive RSI and MACD, Str
Key facts today
Next report date
—
Report period
—
EPS estimate
—
Revenue estimate
—
1.68 USD
541.25 M USD
656.38 M USD
362.77 M
About MARA Holdings, Inc.
Sector
Industry
CEO
Frederick G. Thiel
Website
Headquarters
Hallandale Beach
Founded
2010
ISIN
US5657881067
FIGI
BBG001K7WBT8
MARA Holdings, Inc. is a digital asset technology company, which engages in mining cryptocurrencies with a focus on the Bitcoin ecosystem. It also deals with owning and operating bitcoin mining facilities or data centers, selling proprietary software or technology to third parties operating in the Bitcoin ecosystem, offering advisory and consulting services to support Bitcoin mining ventures in domestic and international jurisdictions, and generating electricity from renewable energy resources or methane gas capture to power Bitcoin mining projects. The company was founded on February 23, 2010 and is headquartered in Hallandale Beach, FL.
Related stocks

MARA the bitcoin minerIf MARA breaks $25 and holds it on volume — that’s we have lift off.
It will signals renewed strength in Bitcoin miners, and MARA tends to lead that charge when the crypto market runs hot.

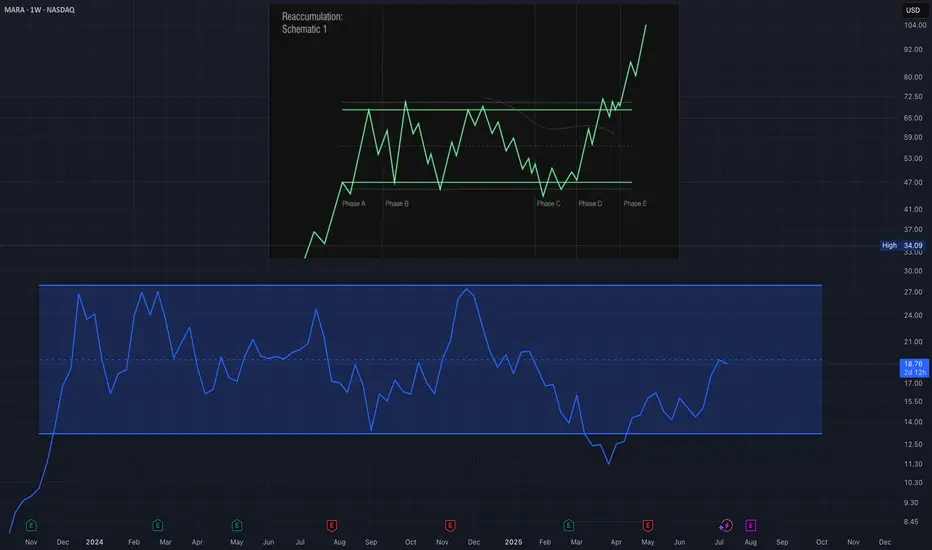
MARA Showing Classic Wyckoff Reaccumulation SetupI’m currently observing what appears to be a Wyckoff Reaccumulation Schematic developing in MARA (Marathon Digital Holdings). After a significant decline, the price seems to have found a floor with a clear Selling Climax (SC), followed by an Automatic Rally (AR) that established the upper boundary o
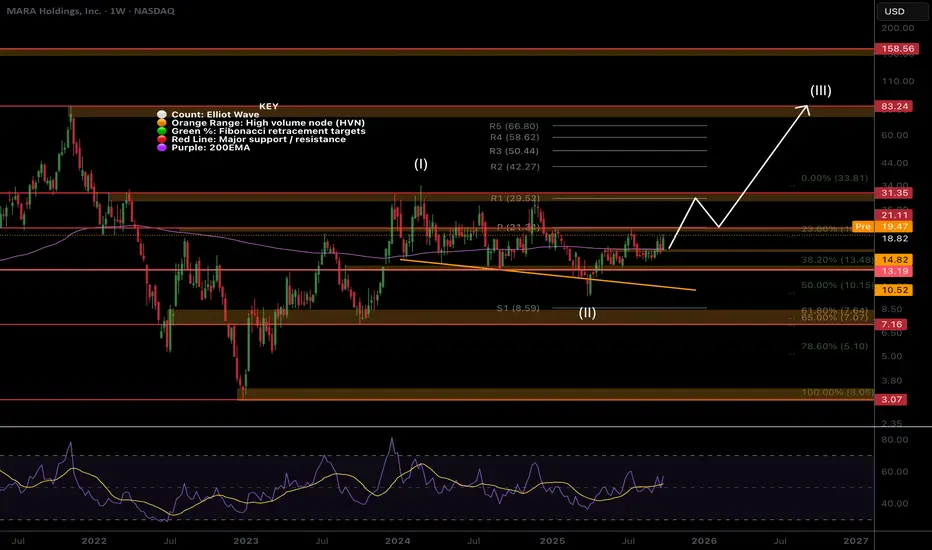
MARA Ready To Finally Move towards $30?MARA’s Elliot Wave (II) retracement front run the Fibonacci golden ratio and has now overcome the weekly 200EMA. The weekly pivot looms as strong resistance $21 just above the first target of our recent trade signal. If wave (III) is underway we should see price begin to accelerate alongside Bitcoin
MARA | My Life Long Girlfriend Stock | LONGMARA Holdings, Inc. is a digital asset technology company, which engages in mining cryptocurrencies with a focus on the Bitcoin ecosystem. It also deals with owning and operating bitcoin mining facilities or data centers, selling proprietary software or technology to third parties operating in the B

MARA StockAnalysisAs of the latest data, Marathon Digital Holdings, Inc. (NASDAQ: MARA) is trading at $20.42.
StockAnalysis
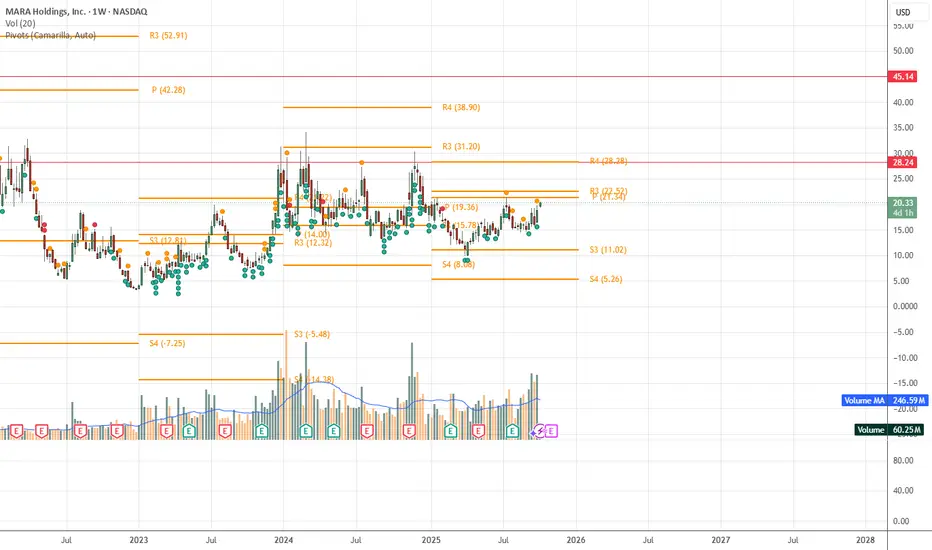
Based on pivot point calculations, here are the key support and resistance levels for MARA:
I will be very happy to reach with this stock 30$ NASDAQ:MARA
Why I am bullish on this stock ? Because I bullish on Bitcoin in mid-term, so if we take level 20$ I will be seeking to 30$ there is big resistance and will be my future cashout. This stock show some potential to do it and I am believing. I am trading this stock a two years and its

MARA EOYMara, mara, mara... *sigh*
Back in Q4 of 2024 I began positioning myself in MARA and set a target of 6-12 months at around 80$. This has not gone as hoped and I am readjusting my target to around 30$ by EOY (worst case scenario). MARA had and even still has a lot going for it as it is still the 2nd

$MARA — Early Reversal in MotionMARA dropped into the 0.618–0.786 Fib retrace zone and bounced right near the 200 EMA. Since then, price has reclaimed above the short EMAs (8/21) and pushed back into the Fib retracement levels.
✅ Entry trigger: Close above 200 EMA confirmed the reversal
🎯 Targets: Fib 1.0 reclaim, then 1.272 and

MARA Huge bullish engulfing!NASDAQ:MARA had a huge bullish engulfing candle yesterdays almost eclipsing 9 days of price action in 1 session, a characteristic candle for wave 3!
Partial take profit target for me is the High Volume Node between the R4 and R5 pivot, $20, where I expect price to struggle before more upside. Next

See all ideas
Summarizing what the indicators are suggesting.
Neutral
SellBuy
Strong sellStrong buy
Strong sellSellNeutralBuyStrong buy
Neutral
SellBuy
Strong sellStrong buy
Strong sellSellNeutralBuyStrong buy
Neutral
SellBuy
Strong sellStrong buy
Strong sellSellNeutralBuyStrong buy
An aggregate view of professional's ratings.
Neutral
SellBuy
Strong sellStrong buy
Strong sellSellNeutralBuyStrong buy
Neutral
SellBuy
Strong sellStrong buy
Strong sellSellNeutralBuyStrong buy
Neutral
SellBuy
Strong sellStrong buy
Strong sellSellNeutralBuyStrong buy
Displays a symbol's price movements over previous years to identify recurring trends.
MARA5513953
MARA Holdings, Inc. 1.0% 01-DEC-2026Yield to maturity
—
Maturity date
Dec 1, 2026
MARA6153309
MARA Holdings, Inc. 2.125% 01-SEP-2031Yield to maturity
—
Maturity date
Sep 1, 2031
US565788AG1
MARA Holdings, Inc. 0.0% 01-JUN-2031Yield to maturity
—
Maturity date
Jun 1, 2031
US565788AE6
MARA Holdings, Inc. 0.0% 01-MAR-2030Yield to maturity
—
Maturity date
Mar 1, 2030
US565788AJ5
MARA Holdings, Inc. 0.0% 01-AUG-2032Yield to maturity
—
Maturity date
Aug 1, 2032
See all MARA bonds
Curated watchlists where MARA is featured.


Frequently Asked Questions
The current price of MARA is 20.84 USD — it has increased by 8.53% in the past 24 hours. Watch MARA Holdings, Inc. stock price performance more closely on the chart.
Depending on the exchange, the stock ticker may vary. For instance, on NASDAQ exchange MARA Holdings, Inc. stocks are traded under the ticker MARA.
MARA stock has risen by 2.90% compared to the previous week, the month change is a 27.78% rise, over the last year MARA Holdings, Inc. has showed a 24.09% increase.
We've gathered analysts' opinions on MARA Holdings, Inc. future price: according to them, MARA price has a max estimate of 30.00 USD and a min estimate of 18.00 USD. Watch MARA chart and read a more detailed MARA Holdings, Inc. stock forecast: see what analysts think of MARA Holdings, Inc. and suggest that you do with its stocks.
MARA reached its all-time high on Mar 19, 2012 with the price of 234.00 USD, and its all-time low was 0.35 USD and was reached on Mar 16, 2020. View more price dynamics on MARA chart.
See other stocks reaching their highest and lowest prices.
See other stocks reaching their highest and lowest prices.
MARA stock is 10.53% volatile and has beta coefficient of 1.96. Track MARA Holdings, Inc. stock price on the chart and check out the list of the most volatile stocks — is MARA Holdings, Inc. there?
Today MARA Holdings, Inc. has the market capitalization of 7.50 B, it has increased by 12.65% over the last week.
Yes, you can track MARA Holdings, Inc. financials in yearly and quarterly reports right on TradingView.
MARA Holdings, Inc. is going to release the next earnings report on Nov 5, 2025. Keep track of upcoming events with our Earnings Calendar.
MARA earnings for the last quarter are 1.84 USD per share, whereas the estimation was −0.07 USD resulting in a 2.58 K% surprise. The estimated earnings for the next quarter are −0.10 USD per share. See more details about MARA Holdings, Inc. earnings.
MARA Holdings, Inc. revenue for the last quarter amounts to 238.50 M USD, despite the estimated figure of 227.92 M USD. In the next quarter, revenue is expected to reach 251.55 M USD.
MARA net income for the last quarter is 808.24 M USD, while the quarter before that showed −533.20 M USD of net income which accounts for 251.58% change. Track more MARA Holdings, Inc. financial stats to get the full picture.
No, MARA doesn't pay any dividends to its shareholders. But don't worry, we've prepared a list of high-dividend stocks for you.
As of Oct 14, 2025, the company has 152 employees. See our rating of the largest employees — is MARA Holdings, Inc. on this list?
EBITDA measures a company's operating performance, its growth signifies an improvement in the efficiency of a company. MARA Holdings, Inc. EBITDA is −44.87 M USD, and current EBITDA margin is −6.24%. See more stats in MARA Holdings, Inc. financial statements.
Like other stocks, MARA shares are traded on stock exchanges, e.g. Nasdaq, Nyse, Euronext, and the easiest way to buy them is through an online stock broker. To do this, you need to open an account and follow a broker's procedures, then start trading. You can trade MARA Holdings, Inc. stock right from TradingView charts — choose your broker and connect to your account.
Investing in stocks requires a comprehensive research: you should carefully study all the available data, e.g. company's financials, related news, and its technical analysis. So MARA Holdings, Inc. technincal analysis shows the strong buy rating today, and its 1 week rating is strong buy. Since market conditions are prone to changes, it's worth looking a bit further into the future — according to the 1 month rating MARA Holdings, Inc. stock shows the strong buy signal. See more of MARA Holdings, Inc. technicals for a more comprehensive analysis.
If you're still not sure, try looking for inspiration in our curated watchlists.
If you're still not sure, try looking for inspiration in our curated watchlists.