META - Weekly ChartFalling wedge has formed. Tested bottom trendline of the wedge and bounced back. Now it can potentially break the top trendline.
There also has a Bullish divergence on Klinger Oscillator.
That can be a trend reversal.
META trade ideas

Meta waiting to break the rangePrice action is stuck in the range and thats why waiting for the candles to break the rectangle area in bullish or bearish ride.
Bullish Indications:
1- Trend was bullish in 1H view but now sideways
2- Major Resistance Levels are 124, 130, 135, 141 which can become support if price is going in bullish ride
Bearish Indications:
1- trend is bearish on 1Day and 4H view but currently in sideways
2- Major Support Levels are 112, 109, 100 which can become resistance if price is going in bearish ride
Biase: Buy Stop Order + Sell Stop Order
Plan A:
Long (Buy Stop)
Entry: 125
SL: 122
TP1: RRR1
TP2: RRR2
TP3: RRR3
Plan B:
Short (Sell Stop)
entry : 111
SL: 113
TP1: RRR1
TP2: RRR2
TP3: RRR3

META Confluence of Resistance in the 118 RangeMETA is trading in a rising wedge, just below December VWAP, which will be intersected by a downtrend line containing all price action since the December high.
Could be an "interesting" week with hedge funds adjusting their year end portfolios, but this looks like a decent short setup... at least at this moment.

-Accumulation of continuation?-The High pivot pointed by SETUP on the weekly chart.
-First pivot high formed on the daily chart's accumulation.
-Second attempted bullish pivot formed on the daily chart's accumulation. It wasn't very far.
-Third and last attempt to pivot the accumulation. Will this time go after the FIBO gold region at $139.66?
-Hour chart suggests that long-term (buy and hold) are defending the bottom region at $102.2, as such, we can see prices going only as low as $135.12.
-Do your analysis and good business.
-Be Aware, If You Buy, Use Stop!
-See below for other reviews.

METAMeta in very bad shape may not survive the coming huge melt down
the whole market will be correted to 2007 price levels

META: Market of Sellers
Hey traders,
Here is our technical analysis on META.
The level where the price is trading right now is major and the price will most likely retrace from that.
❤️ Please, support our work with like & comment! ❤️

FACEBOOK(META) Swing Short! Sell!
Hello,Traders!
FACEBOOK is trading in a downtrend
And the stock is about to retest
The broken key horizontal level
Which is now a resistance
From where a bearish continuation
Is to be expected
Sell!
Like, comment and subscribe to boost your trading!
See other ideas below too!

META Potential for Bullish Rise | 21st December 2022Looking at the H4 chart, my overall bias for META is bullish due to the current price being above the Ichimoku cloud , indicating a bullish market. Looking for a buy entry at 110.85, where the 38.2% Fibonacci line is. Stop loss will be at 96. 40 , where the 78.6% Fibonacci line is. Take profit will be at 137.66, where the 50% Fibonacci line is.
Any opinions, news, research, analyses, prices, other information, or links to third-party sites contained on this website are provided on an "as-is" basis, as general market commentary, and do not constitute investment advice. The market commentary has not been prepared in accordance with legal requirements designed to promote the independence of investment research, and it is therefore not subject to any prohibition on dealing ahead of dissemination. Although this commentary is not produced by an independent source, FXCM takes all sufficient steps to eliminate or prevent any conflicts of interest arising out of the production and dissemination of this communication. The employees of FXCM commit to acting in the clients' best interests and represent their views without misleading, deceiving, or otherwise impairing the clients' ability to make informed investment decisions. For more information about the FXCM's internal organizational and administrative arrangements for the prevention of conflicts, please refer to the Firms' Managing Conflicts Policy. Please ensure that you read and understand our Full Disclaimer and Liability provision concerning the foregoing Information, which can be accessed on the website.

$META Approaching Bear Gap AreaNASDAQ:META is approaching bear gap area. The gap fill is the $119.50 PL, however, I don't think $SPY will allow it. $META should see the $110 PL by EOW.

Will Meta Platforms Retest Lows?Meta Platforms has been under heavy selling pressure all year. Now some traders may look for the social-media giant to retest its lows.
The first pattern on today’s chart is the 50-day simple moving average (SMA). META has remained mostly below this line since 2022 began. That could make trend followers expect prices to continue lower after its most recent test on Monday.
Second, consider the bearish gap on October 27 after earnings missed estimates. Notice how the stock attempted to rebound without filling the entire gap. Also notice how it made a slightly lower high last week relative to December 5.
Third, short-term direction could soon line up with the longer-term downtrend. MACD is nearing a potential bearish crossover. Prices also closed below the 8-day exponential moving average (EMA) and 21-day EMA. If this continues and the fast EMA slips below the slower EMA, it could make some traders expect more follow-through.
TradeStation has, for decades, advanced the trading industry, providing access to stocks, options, futures and cryptocurrencies. See our Overview for more.
Important Information
TradeStation Securities, Inc., TradeStation Crypto, Inc., and TradeStation Technologies, Inc. are each wholly owned subsidiaries of TradeStation Group, Inc., all operating, and providing products and services, under the TradeStation brand and trademark. You Can Trade, Inc. is also a wholly owned subsidiary of TradeStation Group, Inc., operating under its own brand and trademarks. TradeStation Crypto, Inc. offers to self-directed investors and traders cryptocurrency brokerage services. It is neither licensed with the SEC or the CFTC nor is it a Member of NFA. When applying for, or purchasing, accounts, subscriptions, products, and services, it is important that you know which company you will be dealing with. Please click here for further important information explaining what this means.
This content is for informational and educational purposes only. This is not a recommendation regarding any investment or investment strategy. Any opinions expressed herein are those of the author and do not represent the views or opinions of TradeStation or any of its affiliates.
Investing involves risks. Past performance, whether actual or indicated by historical tests of strategies, is no guarantee of future performance or success. There is a possibility that you may sustain a loss equal to or greater than your entire investment regardless of which asset class you trade (equities, options, futures, or digital assets); therefore, you should not invest or risk money that you cannot afford to lose. Before trading any asset class, first read the relevant risk disclosure statements on the Important Documents page, found here: www.tradestation.com .

META: A zone to go shortWe observed heavy selling pressure in the 122.8-124.1 range for META. Since the beginning of December, META has rejected four times at the yellow zone. If META reaches the yellow box zone, watch for price action consistent with the last four reversals.

Short Meta Pretty self explanatory setup here. Double top (can see more clearly on 4hr), Hidden bearish Div on RSI and MacD. Short Meta if you like money. GG's Cuckerberg


META at bottom of upward channel from November lows$META ready to test upward channel from November lows.
Next support at 113-114 if 115 breaks.
Could bounce at 115 if overall market strengthens.

META to the downside?Price failed to break resistance at $123, RSI and Accumulation divergence on the 4hr. Could see some slippage here.

METADont know what to expect from meta this upcoming week just know I will be ready either way she falls, Im bullish if we push past Yesterday's high of 122.82, look to take calls to YH if META can hold above 120.53, Im bearish if we go below YL of 118.18. Keep an eye on the 118.18-118.72 level for it is a critical zone for making meaning a continuation to the downside or a shift to the upside.


$META is approaching the 21EMA on the weekly $META needs to close above the 9EMA on the weekly to continue this momentum. We've handled the $SPY stress test without breaking market structure. This should take off next week after Quad Witching is over.

$META with the 2-2-2u reversal on the Month $META giving me vibes like it wants the $142.5 price level within the next month or so. Also bullish on the week.

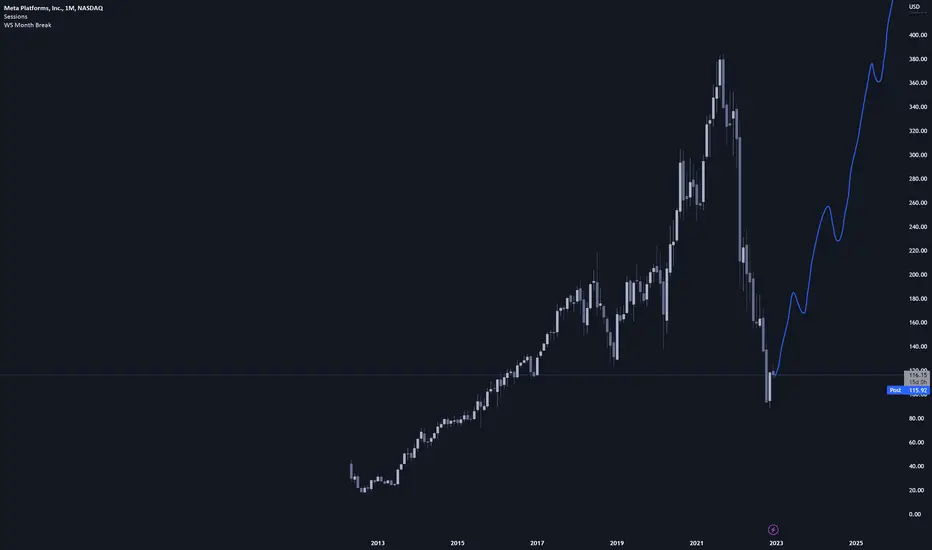
META mega long term opportunityMETA ~-76% from ATH, biggest retracement so far in its history
LONG/Invest ~ 100-120$
Unique buy signal on monthly + fisher cross up monthly

META Diagonal Put 95 Dec 9/100 Dec 16Bear Rally Set Up:
A couple weeks ago we set a new low around 88ish which has lead this back up to the 20 day. It's actually been basing at the 20 for a few days getting ready to make another move. The overall trend is bearish. The entry point was determined by waiting for this to trade below the previous day low. Conditions at these levels solidify an entry point. As for my stops, I'm set up for max loss. So if this doesn't go my way....oh well. Next. I've got my eyes set on 95 as my target. It's out of the money target, but as I said before, the overall trend is bearish and if this does decide to head lower, it may want to fill those gaps it made before it got up here.
Diagonal Spread Strategy:
So,we've established this is a bear rally. I've decided to go with an out of the money diagonal strategy since this has a bearish trend and the overall tech sector is getting weaker. The charting criteria needed to enter this position has been triggered, trading below the previous days candle at the 20 day. The strike prices and expiration dates were determined by envisioning this to fall below 95 by late next week... or right around December 5the or 6th... making it's way back to the apex of the strategy and closing it out December 9th or the 8th. Position management is very simple, if this fall below 95 and stays below it come December 9th I'll just close the entire combo out and move on. I'm set up for max loss, so if this decides to trade sideways or continue higher, it won't matter to me.
Trade Setup:
Meta recently made a new swing low around 88ish. Since then, it's crawled back up to the 20 day and has been pretty stable in this area the last few days. Meta is also still trading below a falling 50-day SMA. This trend analysis is good to move on to the entry criteria. This rally has brought the stock back to the 20 day with lower and somewhat equal volume the last few days. Because it traded below the previous day, it triggered the entry.
T.E.S.T.
Timeframe: I put this out 3 weeks to hit my target.
Entry: My entry was about 109.45ish.
Stop: I'm set up for max loss.
Target: 95
Profit Score:
Potential: 15.00
ATR: 6.62
Score 2.27
Stock Outlook: -1
I'll update this as the days goes by.

FACEBOOK 25 % pump (NEW)After dropping to lows from 2015, most likely we will see a bounce.
-RSI is very oversold both on daily and weekly timeframe.
-We have a gap which most likely will get filled. After filling the gap, we expect the price to come back down.
-The price dropped 75 % from its ATH. Many investors bought meta stock to ride the bounce.

BUY META NOWMeta be done going down. This is like, prolly the best buy for this stock like ever. if you see this and dont take advantage of it now, you finna be kicking yourself later. Good Lick and Good Trading.