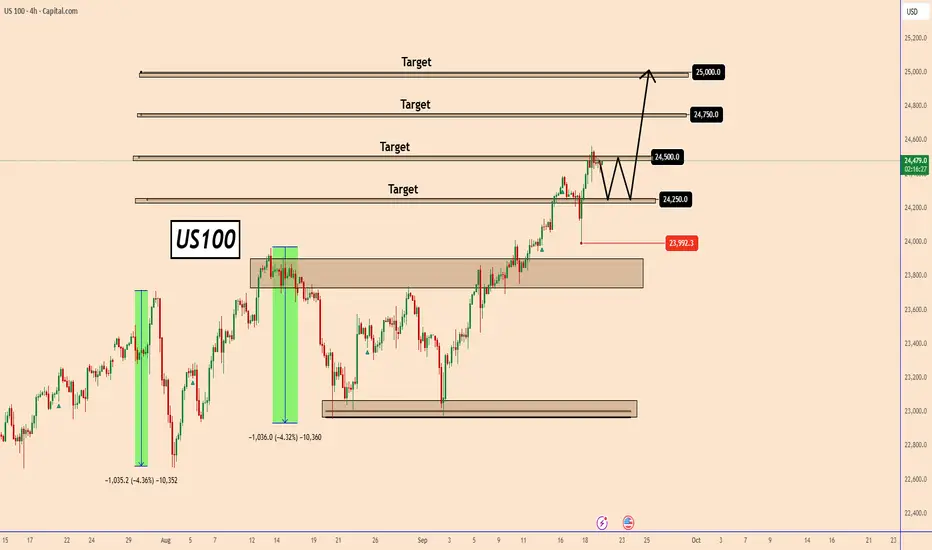
US100 remains in a well-defined uptrendUS100 remains in a well-defined uptrend
After the FOMC cut rates by 25 basis points and also sent a message that two more rate cuts could happen this year, all indices broke out in an uptrend.
US100 felt a surge at 23992 during the FOMC meeting as the market was unclear about what was going on an
About Nasdaq 100 Index
The NASDAQ-100 is an index that is constituted by 100 of the largest companies listed on the NASDAQ stock exchange, which is the second largest in the world only after the New York Stock Exchange by market capitalization. The companies that are listed in this index range from a variety of industries like Technology, Telecommunications, Biotechnology, Media, and Services. The NASDAQ-100 was first calculated in January 31 of 1985 by NASDAQ and it is a modified capitalization-weighted index. This index has been of good reference to investors that want to know how the stock market is performing without financial services companies, this given that the index excludes financial companies.
Related indices
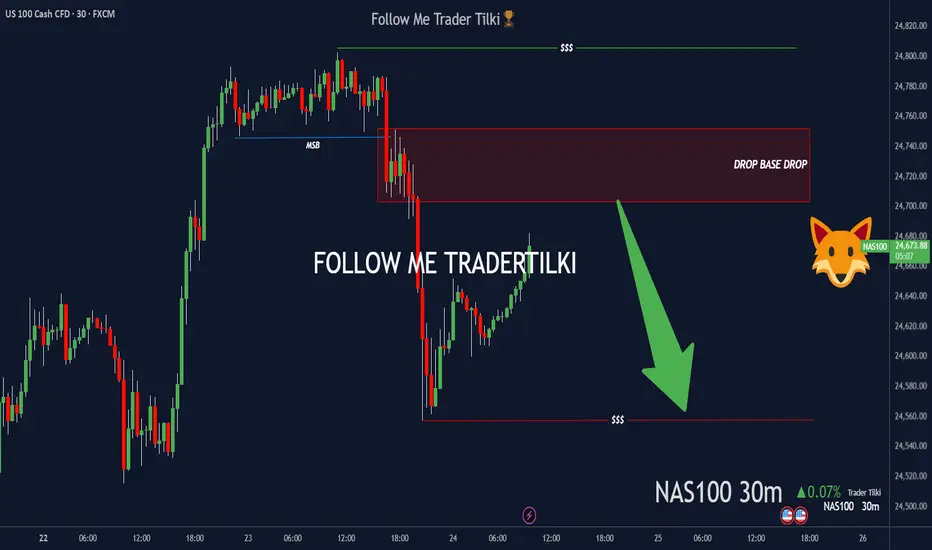
Pressure’s buildin’ on NAS100—could pop any minute.Hey Guys,
Once NAS100 hits my SELL zone, I’m pulling the trigger—targeting 24557.06
• Entry: 24752.05 or 24703.29
Set the stop point according to your own margin, my friends.
Every like you drop pushes me to share more setups like this. Big thanks to everyone showing support!
NAS100 -Head and Shoulders Formed. Price Sitting at the NecklinePrice had been climbing steadily and consistently till now. See my previous analysis:
Or click on the attached idea on my chart.
But momentum is starting to be fading.
And if we look closely, we could recognize a head and shoulders pattern. We have the first peak, the left shoulder. Then a t

NASDAQ NAS100 Analysis: Three-Drive Pattern, VWAP & Trade Plan📊 The NASDAQ 100 has been riding a strong bullish trend, pushing higher with relentless momentum. On the daily timeframe, price now looks heavily overextended 📈.
🔎 Zooming into the 4-hour chart, the overextension is even more apparent. In trending markets, we often observe a three-drive pattern (so

Nasdaq records near critical resistance! More to go or crash?Strong economic data suggest the soft landing scenario remains intact. Manufacturing strength, combined with improving employment data, appears to provide support. The Fed's dovish pivot also offers liquidity tailwinds, while the Nvidia-Intel partnership signals continued investment in US stocks.
B

US100 M30 – Sideway at the Top - Short OpportunityThe CAPITALCOM:US100 index has experienced a strong upward move on the 30-minute chart, pushing price to a new high around the 24,800 – 24,850 zone. However, recently, price has been moving sideways within a narrow range, forming a consolidation phase near this key resistance area. This sideway


2025 vs 2024 Growth comparison and OutlookPEPPERSTONE:NAS100 PEPPERSTONE:NAS100 2025 growth % is now more or less where 2024 was at the same date (+16% YTD) the difference is that last year in September Fed cut 0.5% and there was a bright future with inflation really going down, unemployment low and election coming. This year instead we
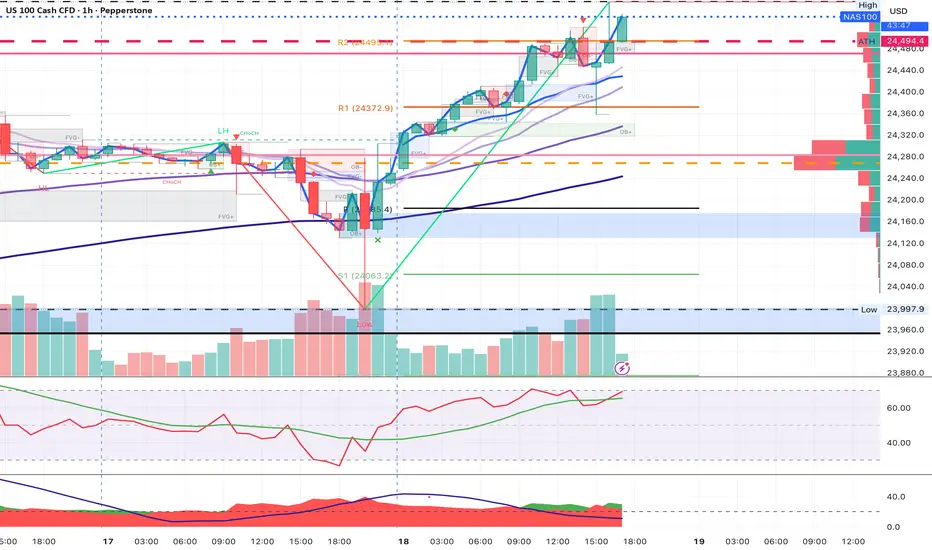
FOMC has cleared liquidity levels around this technical rangeNews Drivers do not overpower technicals, the fundamentally driven movements are just banging around into huge money pending orders. No way around these mechanics.
That what we saw today, and what will continue to happen forever and ever 💎 Not saying it will always be a ricochet like today, but the

NAS100 - Last Quarter Hype or Abyss?Dear Friends in Trading,
Interesting Read:
investinglive.com
Rate cuts invigorate buying optimism at this time:
1.Investing Institutions are undeterred by "overbought conditions"
2. Will I follow the buying Hype?
3. Marching towards 25000 or a cliff?
4. Am I dragged along into extreme red to max

See all ideas
Summarizing what the indicators are suggesting.
Oscillators
Neutral
SellBuy
Strong sellStrong buy
Strong sellSellNeutralBuyStrong buy
Oscillators
Neutral
SellBuy
Strong sellStrong buy
Strong sellSellNeutralBuyStrong buy
Summary
Neutral
SellBuy
Strong sellStrong buy
Strong sellSellNeutralBuyStrong buy
Summary
Neutral
SellBuy
Strong sellStrong buy
Strong sellSellNeutralBuyStrong buy
Summary
Neutral
SellBuy
Strong sellStrong buy
Strong sellSellNeutralBuyStrong buy
Moving Averages
Neutral
SellBuy
Strong sellStrong buy
Strong sellSellNeutralBuyStrong buy
Moving Averages
Neutral
SellBuy
Strong sellStrong buy
Strong sellSellNeutralBuyStrong buy
Displays a symbol's price movements over previous years to identify recurring trends.