TEM — Letting the Higher Timeframe Do the Talking (Feb 12) I’m using a simple top-down approach.
I start on the monthly chart, then move to the week, day, and finally the 4-hour.
The goal is just to find important lines where price keeps reacting.
Those lines can act like support or resistance and help guide better decisions instead of guessing.
I’m still
Next report date
—
Report period
—
EPS estimate
—
Revenue estimate
—
−1.18 USD
−705.81 M USD
693.40 M USD
104.04 M
About Tempus AI, Inc.
Sector
Industry
CEO
Eric Paul Lefkofsky
Website
Headquarters
Chicago
IPO date
Jun 14, 2024
Identifiers
3
ISIN US88023B1035
Tempus AI, Inc. is a healthcare technology company, which engages in bringing artificial intelligence and machine learning to healthcare. It focuses on building platforms for oncology, neuropsychiatry, cardiology, infectious disease, and radiology. The company was founded by Eric Paul Lefkofsky in August 2015 and is headquartered in Chicago, IL.
Related stocks

Tem Top-Down Chart Walkthrough | From Market Structure to EntryIn this video, I walk step-by-step through the Tem chart using a simple top-down trading process designed for beginners and developing traders.
We begin by clearing the chart to remove noise, then move through the higher timeframes, monthly, weekly, and daily — to identify meaningful support and re

TEM – IF / THEN / ELSE Breakdown (Bias: PUTS)Here’s the clean game plan based on the levels shown in the chart so we’re prepared either way.
🔻 Current Structure
Clear downtrend (lower highs + trendline resistance)
Price trading below Pivot (51.82)
Failed push into the 52.98 (TP1 area / prior support now resistance)
Weak bounce off 49.93 (

TEMPUS AI (TEM) - Context Is Building AgainThis is not a signal. This is context rebuilding.
Accumulate perspective (1D)
Price is once again approaching the TrendGo Accumulate zone on the daily timeframe.
Historically, this level has been highly meaningful:
• Every previous pullback into the Accumulate zone resulted in strong ups

TEM - We are back at it, Again !!TEM - Used to love this stock at 40's. Had a very good trade until it was momentum name.
And.... It turned out to be a choppy choppy stock to hold.
Again, it's looking good for a long trade.
With AI theme's surge and Revenue growth, this can see 100 again soon.
Technical -
- Found support o

TEMS | Earnings Catalyst Ignites Technical BreakoutTempus AI ($TEMS) delivered impressive earnings, with recent reports showing triple-digit diagnostic growth — and price action responded strongly.
From a technical perspective, this move aligns perfectly with our previously marked-up zones.
The weekly order block (OB) and fair value gap (FVG) ident


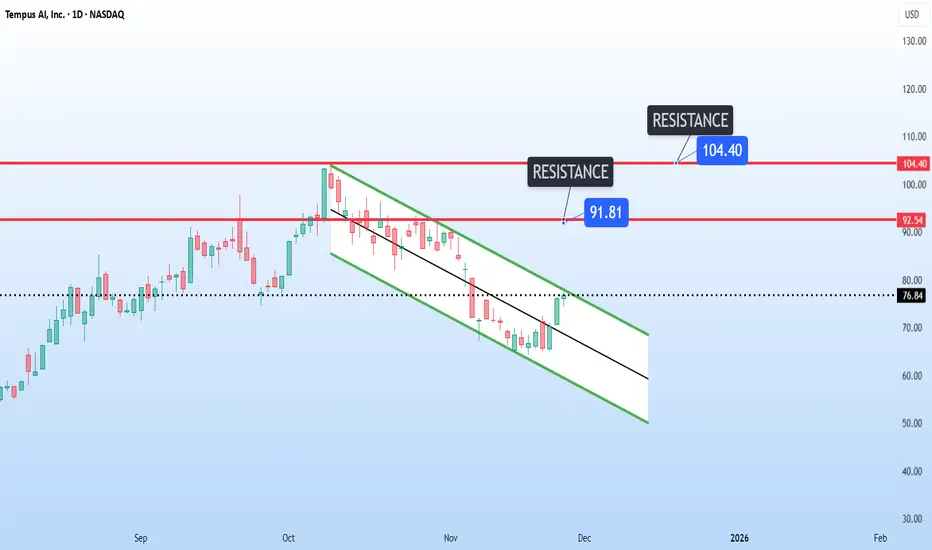
Tempus AI Potential Breakout of ChannelTempus AI NASDAQ:TEM is showing a text-book breakout setup on the daily chart.
It is hovering right at the top of the descending channel at 76, putting pressure on the trendline for a potential breakout.
The next key resistance levels could be at 91 and 104.
TEM eyes on $71.94: Break-n-Retest should mark a BOTTOMTEM has been retracing with all other AI stocks.
Now testing a Semi-Major Genesis fib at $71.94
Look for a Break-n-Retest to enter longs or to add.

See all ideas
Summarizing what the indicators are suggesting.
Neutral
SellBuy
Strong sellStrong buy
Strong sellSellNeutralBuyStrong buy
Neutral
SellBuy
Strong sellStrong buy
Strong sellSellNeutralBuyStrong buy
Neutral
SellBuy
Strong sellStrong buy
Strong sellSellNeutralBuyStrong buy
An aggregate view of professional's ratings.
Neutral
SellBuy
Strong sellStrong buy
Strong sellSellNeutralBuyStrong buy
Neutral
SellBuy
Strong sellStrong buy
Strong sellSellNeutralBuyStrong buy
Neutral
SellBuy
Strong sellStrong buy
Strong sellSellNeutralBuyStrong buy
Displays a symbol's price movements over previous years to identify recurring trends.
Frequently Asked Questions
The current price of TEM is 51.95 USD — it has increased by 2.30% in the past 24 hours. Watch Tempus AI, Inc. stock price performance more closely on the chart.
Depending on the exchange, the stock ticker may vary. For instance, on NASDAQ exchange Tempus AI, Inc. stocks are traded under the ticker TEM.
TEM stock has fallen by −2.82% compared to the previous week, the month change is a −22.28% fall, over the last year Tempus AI, Inc. has showed a −32.68% decrease.
We've gathered analysts' opinions on Tempus AI, Inc. future price: according to them, TEM price has a max estimate of 105.00 USD and a min estimate of 76.00 USD. Watch TEM chart and read a more detailed Tempus AI, Inc. stock forecast: see what analysts think of Tempus AI, Inc. and suggest that you do with its stocks.
TEM stock is 4.40% volatile and has beta coefficient of 2.24. Track Tempus AI, Inc. stock price on the chart and check out the list of the most volatile stocks — is Tempus AI, Inc. there?
Today Tempus AI, Inc. has the market capitalization of 9.24 B, it has increased by 2.05% over the last week.
Yes, you can track Tempus AI, Inc. financials in yearly and quarterly reports right on TradingView.
Tempus AI, Inc. is going to release the next earnings report on Feb 24, 2026. Keep track of upcoming events with our Earnings Calendar.
TEM earnings for the last quarter are −0.11 USD per share, whereas the estimation was −0.17 USD resulting in a 36.15% surprise. The estimated earnings for the next quarter are −0.04 USD per share. See more details about Tempus AI, Inc. earnings.
Tempus AI, Inc. revenue for the last quarter amounts to 334.21 M USD, despite the estimated figure of 328.70 M USD. In the next quarter, revenue is expected to reach 361.94 M USD.
TEM net income for the last quarter is −79.98 M USD, while the quarter before that showed −42.84 M USD of net income which accounts for −86.69% change. Track more Tempus AI, Inc. financial stats to get the full picture.
No, TEM doesn't pay any dividends to its shareholders. But don't worry, we've prepared a list of high-dividend stocks for you.
As of Feb 16, 2026, the company has 2.4 K employees. See our rating of the largest employees — is Tempus AI, Inc. on this list?
EBITDA measures a company's operating performance, its growth signifies an improvement in the efficiency of a company. Tempus AI, Inc. EBITDA is −148.01 M USD, and current EBITDA margin is −93.91%. See more stats in Tempus AI, Inc. financial statements.
Like other stocks, TEM shares are traded on stock exchanges, e.g. Nasdaq, Nyse, Euronext, and the easiest way to buy them is through an online stock broker. To do this, you need to open an account and follow a broker's procedures, then start trading. You can trade Tempus AI, Inc. stock right from TradingView charts — choose your broker and connect to your account.
Investing in stocks requires a comprehensive research: you should carefully study all the available data, e.g. company's financials, related news, and its technical analysis. So Tempus AI, Inc. technincal analysis shows the strong sell today, and its 1 week rating is sell. Since market conditions are prone to changes, it's worth looking a bit further into the future — according to the 1 month rating Tempus AI, Inc. stock shows the strong sell signal. See more of Tempus AI, Inc. technicals for a more comprehensive analysis.
If you're still not sure, try looking for inspiration in our curated watchlists.
If you're still not sure, try looking for inspiration in our curated watchlists.