MARA (1 Day Chart Review) If price breaks $11.09–$11.13 with body + wick underneath, expect:
Downside Targets
• $10.55 — first magnet
• Wick zone: $10.10 → $9.60
• If $9.60 fails to bounce, next major target = $7.16
If $9.60 Holds
Expect a strong bounce with volume.
Upside targets on reversal:
• Must reclaim $10.10
•
Next report date
—
Report period
—
EPS estimate
—
Revenue estimate
—
2.43 USD
541.25 M USD
656.38 M USD
371.29 M
About MARA Holdings, Inc.
Sector
Industry
CEO
Frederick G. Thiel
Website
Headquarters
Hallandale Beach
Founded
2010
ISIN
US5657881067
FIGI
BBG001K7WBT8
MARA Holdings, Inc. is a digital asset technology company, which engages in mining cryptocurrencies with a focus on the Bitcoin ecosystem. It also deals with owning and operating bitcoin mining facilities or data centers, selling proprietary software or technology to third parties operating in the Bitcoin ecosystem, offering advisory and consulting services to support Bitcoin mining ventures in domestic and international jurisdictions, and generating electricity from renewable energy resources or methane gas capture to power Bitcoin mining projects. The company was founded on February 23, 2010 and is headquartered in Hallandale Beach, FL.
Related stocks

MARA in BUY ZONEMy trading plan is very simple.
I buy or sell when at either of these events happen:
* Price tags the top or bottom of parallel channel zones
* Money flow volume spikes beyond it's Bollinger Bands
So...
Here's why I'm picking this symbol to do the thing.
Price in buying zone at bottom of channe

$MARA Unveiled! - 11/14/2025
NASDAQ:MARA Unveiled!
The complex correction structure wrapped up at $12.11 or $12.09 (Stop-Loss), setting the stage for a fast-paced counter swing—neutralizing the decline caused by wave e.
Targets are charted. The chart outlines how the correction evolved and the patterns selected to complete

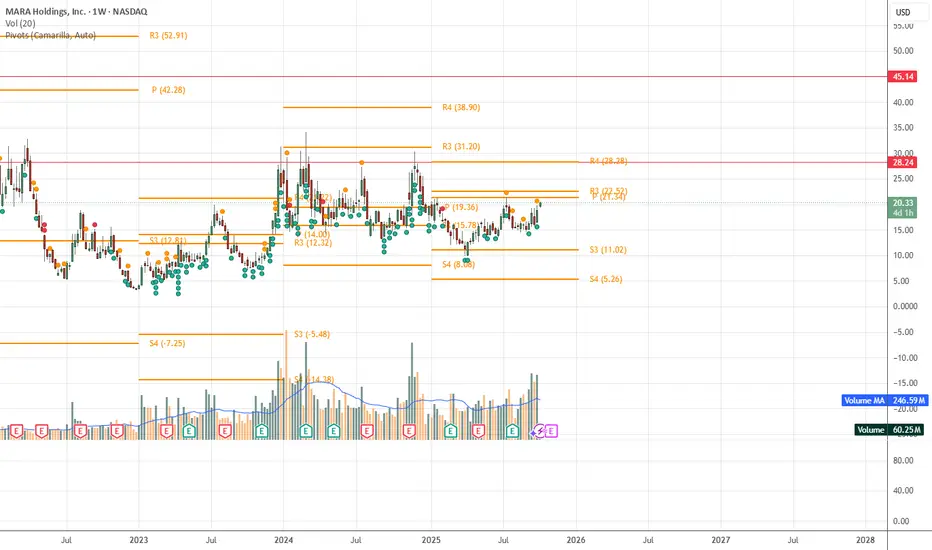
MARA StockAnalysisAs of the latest data, Marathon Digital Holdings, Inc. (NASDAQ: MARA) is trading at $20.42.
StockAnalysis
Based on pivot point calculations, here are the key support and resistance levels for MARA:
MARA se di ve dau
MARA is oversold, weak, sad, and very much in a Wyckoff mark-down phase.
Trend & momentum across all timeframes? Trash (1–2 out of 5).
Support ~$12–12.50, resistance ~$15–18.
Recent news = downgrades + regulatory headaches.
Bias: Bearish with a sprinkle of “okay maybe it dead-cat bounces.”
Two

MARA boring... Investors cant waitMara has the potential for a strong move alongside Bitcoin but has ultimately been boring. Investors struggle the most with boredom and see is as negative and bearish. This is not the case and it could just be accumulating towards a strong breakout.
Price is stalling at the weekly pivot as expected
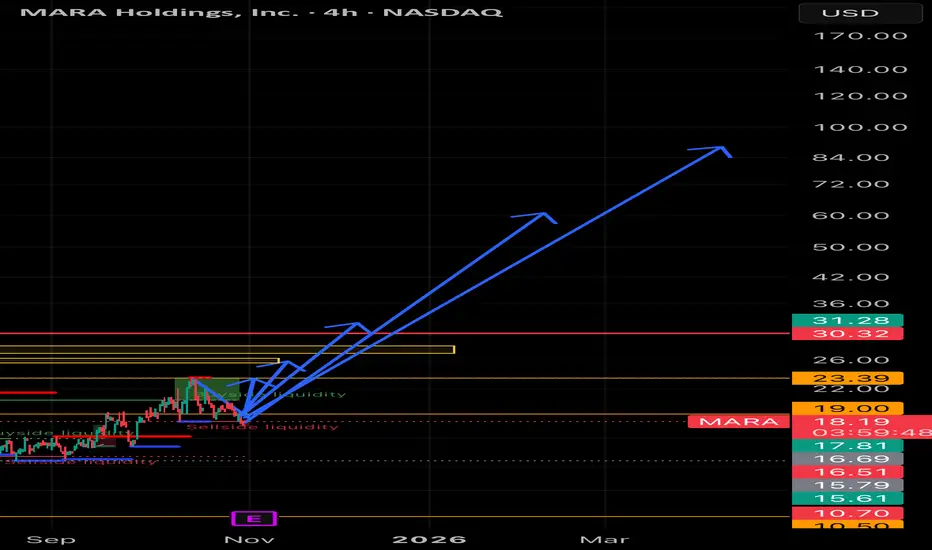
MARA Holdings – Bullish Continuation Setup (Bitcoin Correlation
MARA is showing a similar structure to RIOT and looks primed for a major leg up if Bitcoin strength continues. Price has pulled back into the $17–$18 zone, holding strong structure support and showing signs of accumulation.
From here, I’m watching for a breakout above $19 to confirm momentum, fol
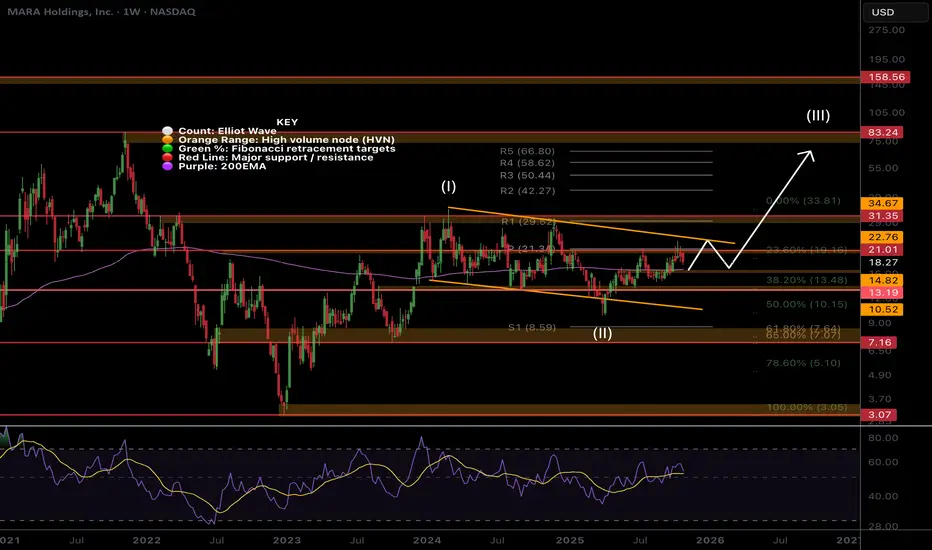
MARA Strong breakout incomingNASDAQ:MARA is stalling at the weekly pivot as expected but is above the 200EMA. Wave (II) appears complete at the 0.5 Fibonacci retracement with a swing below the lower boundary trend-line.
Wave 3 of (III) appears to be underway so I am looking for an aggressive breakout to the upside once we cle

Mara Holding Stock Long InvestmentMARA Holdings Inc. (NASDAQ: MARA) is a leading digital asset technology company specializing in cryptocurrency mining, particularly Bitcoin. Headquartered in Fort Lauderdale, Florida, the company operates large-scale mining facilities in the United States and Europe. As of August 2025, MARA is the s

Next wave might be shaping up I am bullish above $14.53. I would like to see price close over the daily 20 ema, but sometimes that happens via bigger move without me. So smaller size, loose stop.
My target is $21.50 to $23 range, price action depending.
So it's a support trade, in a wave to wave setup.
Good luck, btw I am n

See all ideas
Summarizing what the indicators are suggesting.
Neutral
SellBuy
Strong sellStrong buy
Strong sellSellNeutralBuyStrong buy
Neutral
SellBuy
Strong sellStrong buy
Strong sellSellNeutralBuyStrong buy
Neutral
SellBuy
Strong sellStrong buy
Strong sellSellNeutralBuyStrong buy
An aggregate view of professional's ratings.
Neutral
SellBuy
Strong sellStrong buy
Strong sellSellNeutralBuyStrong buy
Neutral
SellBuy
Strong sellStrong buy
Strong sellSellNeutralBuyStrong buy
Neutral
SellBuy
Strong sellStrong buy
Strong sellSellNeutralBuyStrong buy
Displays a symbol's price movements over previous years to identify recurring trends.
US565788AJ5
MARA Holdings, Inc. 0.0% 01-AUG-2032Yield to maturity
—
Maturity date
Aug 1, 2032
MARA6153309
MARA Holdings, Inc. 2.125% 01-SEP-2031Yield to maturity
—
Maturity date
Sep 1, 2031
MARA5513953
MARA Holdings, Inc. 1.0% 01-DEC-2026Yield to maturity
—
Maturity date
Dec 1, 2026
US565788AG1
MARA Holdings, Inc. 0.0% 01-JUN-2031Yield to maturity
—
Maturity date
Jun 1, 2031
US565788AE6
MARA Holdings, Inc. 0.0% 01-MAR-2030Yield to maturity
—
Maturity date
Mar 1, 2030
See all MARA bonds
Curated watchlists where MARA is featured.


Frequently Asked Questions
The current price of MARA is 10.07 USD — it has decreased by −1.66% in the past 24 hours. Watch MARA Holdings, Inc. stock price performance more closely on the chart.
Depending on the exchange, the stock ticker may vary. For instance, on NASDAQ exchange MARA Holdings, Inc. stocks are traded under the ticker MARA.
MARA stock has fallen by −18.72% compared to the previous week, the month change is a −48.54% fall, over the last year MARA Holdings, Inc. has showed a −60.06% decrease.
We've gathered analysts' opinions on MARA Holdings, Inc. future price: according to them, MARA price has a max estimate of 30.00 USD and a min estimate of 16.00 USD. Watch MARA chart and read a more detailed MARA Holdings, Inc. stock forecast: see what analysts think of MARA Holdings, Inc. and suggest that you do with its stocks.
MARA reached its all-time high on Mar 19, 2012 with the price of 234.00 USD, and its all-time low was 0.35 USD and was reached on Mar 16, 2020. View more price dynamics on MARA chart.
See other stocks reaching their highest and lowest prices.
See other stocks reaching their highest and lowest prices.
MARA stock is 7.93% volatile and has beta coefficient of 1.97. Track MARA Holdings, Inc. stock price on the chart and check out the list of the most volatile stocks — is MARA Holdings, Inc. there?
Today MARA Holdings, Inc. has the market capitalization of 3.81 B, it has decreased by −19.47% over the last week.
Yes, you can track MARA Holdings, Inc. financials in yearly and quarterly reports right on TradingView.
MARA Holdings, Inc. is going to release the next earnings report on Mar 4, 2026. Keep track of upcoming events with our Earnings Calendar.
MARA earnings for the last quarter are 0.27 USD per share, whereas the estimation was 0.02 USD resulting in a 992.04% surprise. The estimated earnings for the next quarter are −0.37 USD per share. See more details about MARA Holdings, Inc. earnings.
MARA Holdings, Inc. revenue for the last quarter amounts to 252.41 M USD, despite the estimated figure of 251.71 M USD. In the next quarter, revenue is expected to reach 261.95 M USD.
MARA net income for the last quarter is 123.13 M USD, while the quarter before that showed 808.24 M USD of net income which accounts for −84.77% change. Track more MARA Holdings, Inc. financial stats to get the full picture.
No, MARA doesn't pay any dividends to its shareholders. But don't worry, we've prepared a list of high-dividend stocks for you.
As of Nov 23, 2025, the company has 152 employees. See our rating of the largest employees — is MARA Holdings, Inc. on this list?
EBITDA measures a company's operating performance, its growth signifies an improvement in the efficiency of a company. MARA Holdings, Inc. EBITDA is 11.00 K USD, and current EBITDA margin is −6.24%. See more stats in MARA Holdings, Inc. financial statements.
Like other stocks, MARA shares are traded on stock exchanges, e.g. Nasdaq, Nyse, Euronext, and the easiest way to buy them is through an online stock broker. To do this, you need to open an account and follow a broker's procedures, then start trading. You can trade MARA Holdings, Inc. stock right from TradingView charts — choose your broker and connect to your account.
Investing in stocks requires a comprehensive research: you should carefully study all the available data, e.g. company's financials, related news, and its technical analysis. So MARA Holdings, Inc. technincal analysis shows the sell today, and its 1 week rating is strong sell. Since market conditions are prone to changes, it's worth looking a bit further into the future — according to the 1 month rating MARA Holdings, Inc. stock shows the strong sell signal. See more of MARA Holdings, Inc. technicals for a more comprehensive analysis.
If you're still not sure, try looking for inspiration in our curated watchlists.
If you're still not sure, try looking for inspiration in our curated watchlists.