NATGAS - CHANGE OF CHARACTERHello Traders !
The NATGAS price failed to create a new lower low.
Currently, The last lower high (2.543 - 2.592) is broken (change of character)
So, I expect a bullish move📈
----------------
TARGET: 2.728🎯

Are we thinking of Fundamental Analysis enough?Norway's gas exports to Europe fell sharply on Monday as a shutdown of the offshore Sleipner hub halted operations at the Nyhamna onshore processing plant, pipeline operator Gassco said, lifting European prices to their highest level this year.
The outage was caused by a crack discovered in a two-in

NATGAS - Time for a pullback? There is a high possibility we are going down on the GAS
Technicals
1. We closed on a doji on the weekly
2. We have been pumping strong lately, and the charts are screaming for a pullback
3. We came to a key .618 FIB retracement level
4. I see a zone here which can act as a major resistance.

NATURAL GAS - IMPORTANT BREAKOUT 📉Hello Traders !
The Natural Gas price failed to create a new higher high !
The higher low (2.543 - 2.570) is broken (change of character).
So, I predict a bearish move📉.
--------------
TARGET: 2.230🎯

Natural Gas: Wild price action!Is natural gas a buy at these levels?
Nat gas is currently digesting its recent rally.
You have to expect the bulls to make another push higher at some point but with todays reversal the bulls may have to wait a bit longer.
Resource stocks took another hit today but still holding near the high

Natgas - rebound phase - shortI want to be honest..
The rally long was a surprise for me, I expected a long phase but without this momentum.
It was really strange because we have a big storage increase more than last year and I expected a long phase but more flat.
so I think now we can have a rebound of price until support are

Natural Gas SurfingZones and levels or shapes for potential support/resistance forces that might influence this market in the future. Dotted path is an envisioned scenario which doesn't need to manifest necessarily but the overall picture might come in handy if the market shows signs of synchronicity with the design.

Natural Gass CompassIn this one I use my preferred charting tool that uses data points from the past: Curved Trendlines. While there are other variations of such lines that I might use depending on the context, in this case the pattern low-high-high or high-low-low is widely detected as relevant and used as such for ma

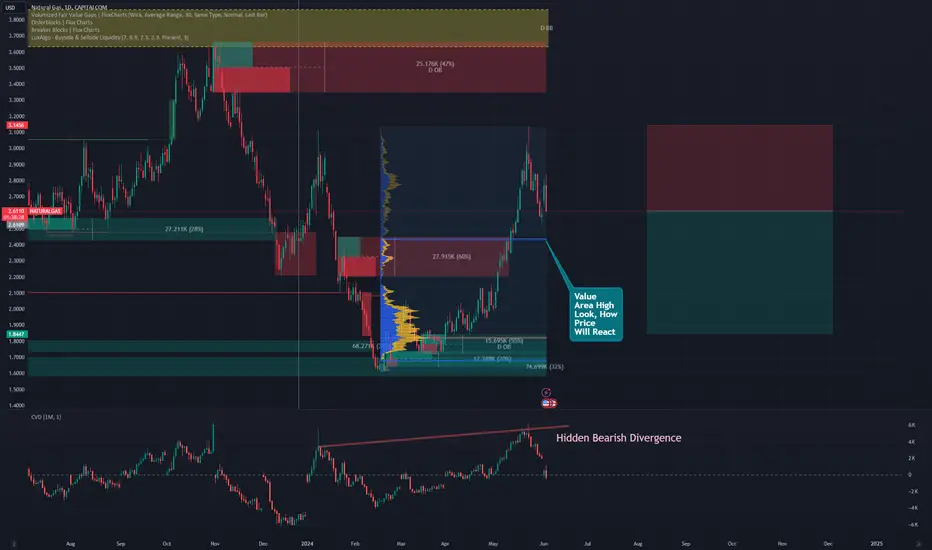
We are dropping - again!NATGAS has shown a remarkable recovery since February 2024. This recovery now appears to have come to an end—at least temporarily. From a technical chart perspective, the recent double top indicates a bleak situation, suggesting further declining prices. A bounce is possible at the high of the Value
NaturalGas ABC correctionReject from first line of suport or from second line of support. If price go above and take this zone like support than we can see target like 3.3 or 3.6 in a few candels

See all ideas