$NBIS Fundamental Catalysts and Institutional Confidence
NASDAQ:NBIS The core investment thesis for Nebius is powerfully underpinned by its recently secured position as a critical infrastructure partner for AI industry leaders. The landmark $17.4 billion, five-year agreement with Microsoft, announced in
Next report date
—
Report period
—
EPS estimate
—
Revenue estimate
—
0.92 USD
143.20 M USD
117.50 M USD
202.40 M
About Nebius Group N.V.
Sector
Industry
CEO
Arkady Volozh
Website
Headquarters
Amsterdam
Founded
2004
ISIN
NL0009805522
FIGI
BBG001NVJ6W4
IPO date
May 24, 2011
IPO offer price
25.00 USD
Nebius Group NV is a technology company that provides infrastructure and services to AI builders worldwide. It offers Nebius AI, an AI-centric cloud platform provides full-stack infrastructure, including large-scale GPU clusters, cloud services, and developer tools. The company also operates through specialized brands: Toloka AI, which partners in data for generative AI development; TripleTen, an edtech platform focused on re-skilling individuals for tech careers; and Avride, which develops autonomous driving technology. Nebius Group was founded by Elena Kolmanovskaya, Ilya Segalovich, Mikhail Fadeev, and Arkady Volozh in 1989 and is headquartered in Amsterdam, the Netherlands.
Related stocks

NEBUIS BREAKOUT??The chart shows NBIS trading in a short-term uptrend, the trendline that has been tested multiple times, we are seeing consistent higher lows and strong buyer interest. Price is currently pushing into a major resistance zone at the 200MA, which has acted as a rejection point in the past. There are t

$NBIS is most likely in a broad range for a whileNebius is an AI-centric cloud + GPU infrastructure play. Great narrative for the coming years.
But technically, I’d wait. It just triggered a correction after ~25 weeks of trend strength and made small double-top. Historically, it usually needs more time.
Next ~6 months probabilities:
20%: strong
NBIS Bearish ContinuationNBIS on the 1D chart is locked in a clear downtrend since mid-October, rolling over from highs above 140 to consolidate around the 94 area. Price is trading below the 20-day MA (~99.40) and 60-day MA at 106.23, while still holding above the long-term 120-day MA near 81.57. Momentum confirms the bear

NBIS NeutralSupport Zone
Long entry 88
Stop 80,
Target 120
Risk management is much more important than a good entry point.
I am not a PRO trader.
In my trading plan, the Max Risk of each short term trade should be less than 1% of an account.

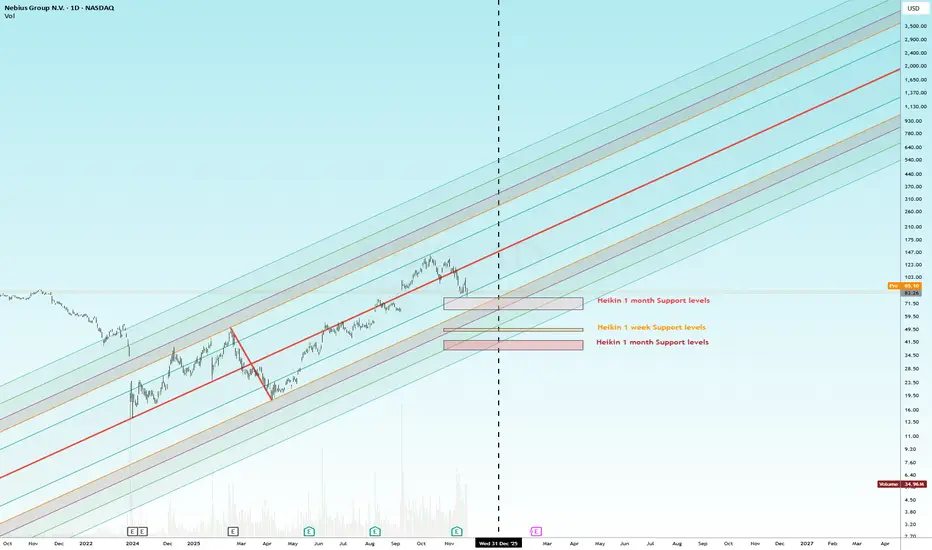
Next support levels for NBISAfter breaking down past week, now we face a very important week for markets, where we have almost a data issued every day.
These are the supports for the downside, where the last one means almost a 60% down.
If we are able to respect the upper monthly support, the trend can continue up, but also
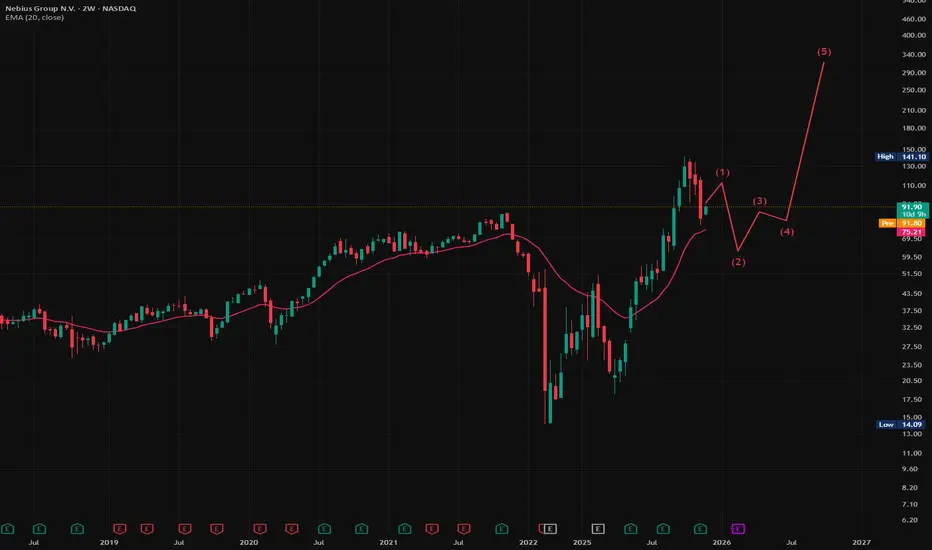
More downfall in NBISNBIS waves still look very much in middle of a 7 wave down move correction (6 completed). The 7th wave is going to be sharp, fill all gaps, touch long standing trend resistance line which interesects with 0.5 levels of complete upmove.
Wait for a better entry at $58 mark.

NBIS US🌎Nebius (NBIS) — Strong Growth on the AI Wave
In Q3, revenue from the core data center business reached $146.1 million, a staggering 355% year-over-year growth.
The partnership with Microsoft is fundamentally changing the scale of Nebius's business. Annual recurring revenue (ARR), the company's

NBIS Bearish Setup?NBIS spent most of 2025 trending higher, but the tone flipped after late-October’s peak. Price sliced below the 20- and 60-day MAs and is now pressing a critical demand zone at 101.91–99.80 (neckline/MA60 vicinity). A clear Double Top at 135.00 caps the structure, while MACD momentum is decisively n

Can NBIS close the 1.618 retracement by EoY?Tomorrow NBIS present their Q3 results.
If we think of a (final?) End-of-Year rally for all related AI stocks, NBIS could be following the ascending channel and reach the 266 $ level by 31st December 2025. That is a 140% ...
If things go very wrong tomorrow and NBIS lose the ascending trend, the

See all ideas
Summarizing what the indicators are suggesting.
Neutral
SellBuy
Strong sellStrong buy
Strong sellSellNeutralBuyStrong buy
Neutral
SellBuy
Strong sellStrong buy
Strong sellSellNeutralBuyStrong buy
Neutral
SellBuy
Strong sellStrong buy
Strong sellSellNeutralBuyStrong buy
An aggregate view of professional's ratings.
Neutral
SellBuy
Strong sellStrong buy
Strong sellSellNeutralBuyStrong buy
Neutral
SellBuy
Strong sellStrong buy
Strong sellSellNeutralBuyStrong buy
Neutral
SellBuy
Strong sellStrong buy
Strong sellSellNeutralBuyStrong buy
Displays a symbol's price movements over previous years to identify recurring trends.
US63954QAE6
Nebius Group N.V. 1.0% 15-SEP-2030Yield to maturity
—
Maturity date
Sep 15, 2030
US63954QAF3
Nebius Group N.V. 2.75% 15-SEP-2032Yield to maturity
—
Maturity date
Sep 15, 2032
See all NBIS bonds
Frequently Asked Questions
The current price of NBIS is 102.80 USD — it has increased by 3.92% in the past 24 hours. Watch Nebius Group N.V. stock price performance more closely on the chart.
Depending on the exchange, the stock ticker may vary. For instance, on NASDAQ exchange Nebius Group N.V. stocks are traded under the ticker NBIS.
NBIS stock has risen by 9.54% compared to the previous week, the month change is a −8.50% fall, over the last year Nebius Group N.V. has showed a 237.05% increase.
We've gathered analysts' opinions on Nebius Group N.V. future price: according to them, NBIS price has a max estimate of 211.00 USD and a min estimate of 110.00 USD. Watch NBIS chart and read a more detailed Nebius Group N.V. stock forecast: see what analysts think of Nebius Group N.V. and suggest that you do with its stocks.
NBIS reached its all-time high on Oct 10, 2025 with the price of 141.10 USD, and its all-time low was 9.94 USD and was reached on Aug 24, 2015. View more price dynamics on NBIS chart.
See other stocks reaching their highest and lowest prices.
See other stocks reaching their highest and lowest prices.
NBIS stock is 6.54% volatile and has beta coefficient of 2.91. Track Nebius Group N.V. stock price on the chart and check out the list of the most volatile stocks — is Nebius Group N.V. there?
Today Nebius Group N.V. has the market capitalization of 24.64 B, it has increased by 3.23% over the last week.
Yes, you can track Nebius Group N.V. financials in yearly and quarterly reports right on TradingView.
Nebius Group N.V. is going to release the next earnings report on Feb 17, 2026. Keep track of upcoming events with our Earnings Calendar.
NBIS earnings for the last quarter are −0.43 USD per share, whereas the estimation was −0.56 USD resulting in a 21.86% surprise. The estimated earnings for the next quarter are −1.21 USD per share. See more details about Nebius Group N.V. earnings.
Nebius Group N.V. revenue for the last quarter amounts to 146.10 M USD, despite the estimated figure of 157.88 M USD. In the next quarter, revenue is expected to reach 250.69 M USD.
NBIS net income for the last quarter is −119.60 M USD, while the quarter before that showed 584.40 M USD of net income which accounts for −120.47% change. Track more Nebius Group N.V. financial stats to get the full picture.
No, NBIS doesn't pay any dividends to its shareholders. But don't worry, we've prepared a list of high-dividend stocks for you.
As of Dec 5, 2025, the company has 1.37 K employees. See our rating of the largest employees — is Nebius Group N.V. on this list?
EBITDA measures a company's operating performance, its growth signifies an improvement in the efficiency of a company. Nebius Group N.V. EBITDA is −262.50 M USD, and current EBITDA margin is −301.62%. See more stats in Nebius Group N.V. financial statements.
Like other stocks, NBIS shares are traded on stock exchanges, e.g. Nasdaq, Nyse, Euronext, and the easiest way to buy them is through an online stock broker. To do this, you need to open an account and follow a broker's procedures, then start trading. You can trade Nebius Group N.V. stock right from TradingView charts — choose your broker and connect to your account.
Investing in stocks requires a comprehensive research: you should carefully study all the available data, e.g. company's financials, related news, and its technical analysis. So Nebius Group N.V. technincal analysis shows the buy rating today, and its 1 week rating is buy. Since market conditions are prone to changes, it's worth looking a bit further into the future — according to the 1 month rating Nebius Group N.V. stock shows the buy signal. See more of Nebius Group N.V. technicals for a more comprehensive analysis.
If you're still not sure, try looking for inspiration in our curated watchlists.
If you're still not sure, try looking for inspiration in our curated watchlists.