Where will DIS find support?Previous supports at ~166.03, ~160.53, and ~153.86 will be important points to watch on the way down.
DIS trade ideas

DISNEYDISNEY has an head and shoulders if fullfilled,prices goes to 138! However, Disney also has a rsi oversold on daily. Which means we may see a bounce (making the right shoulder). Price above 190 negates the head and shoulders
Playing the right shoulder for now! Price can go upto 180 by July. I believe with the reopening soon! Any dips is a buying opp on the mouse! May the mouse be with you!

$DIS with a Bearish outlook following its earnings #Stocks The PEAD projected a Bearish outlook for $DIS after a Negative over reaction following its earnings release placing the stock in drift C
If you would like to see the Drift for another stock please message us. Also click on the Like Button if this was useful and follow us or join us.

mouse housescooping up DIS at ~$165. The technical setup looking good on every chart overlay. Majority of it's latest sell-off appears exhausted IMO. I traded in & out post earnings when the market rallied the following morning, but could tell it would retest lows shortly after by its RSI. Just wants to trade lousy until it has a solid support ricochet level.

DIS bearish DIS has been in a downtrend for a while and once it reaches 154 I would look for an entry to go long on. Too add on to it, we can see that it acted previously as a strong resistance which caused a major downtrend.
Unless Disney is able to break the trend line resistance it will be heading to 154
Happy trading :)

$DIS Although DIS reported a better than expected earnings report, the stock along with call premiums dropped immensely.
Buyers stepped in around $168 and there was a lot of volume on Friday, my level of support for DIS is marked at $165. I don't think it will go lower, but if it breaks below it could also result in a 200 EMA breakdown, then my bullish analysis is invalidated and it could see $147 range next.
I also noticed a Hammer Candle on DIS Daily Chart, which is usually a bullish reversal signal, I think DIS is a great stock for both long-term holding and trading, right now is a perfect opportunity to buy some swings for June or later, get them now while premiums are low!
PS, I have been learning more about elliot wave theory and wave analysis. This is the first time I drew an elliot impulse wave on any of my charts, therefore feedback would be greatly appreciated as well if it looks silly to some of you experts.
Cheers and happy trading!

Pull Back FishingGaps down are considered bearish, but if close if with a doji showing indecision, then not quite so bearish sometimes. Folks are not quite sure just yet it seems (o: DIS appears to have been in a descending triangle before the fall.
No guarantees in this life though and no recommendation

DIS - Mickey its not funny!-The Walt Disney Company reported better-than-expected earnings per share on Thursday, but that didn’t stop its stock price from taking an after-hours nosedive.
-That’s because the entertainment giant reported slower-than-expected growth for its Disney Plus streaming service. The service now has 103.6 million paid subscribers, versus a consensus estimate of 109 million cited by CNBC.
-The hit underscores the extent to which Disney—a diverse conglomerate with theme parks, TV networks, movie studios, and a vast consumer products division—is now wholly reliant on one metric. “Nothing else seems to matter,” analysts MoffettNathanson said in a research note Friday.
Our Target:
Disney is a strong stock, we don't think it will drop below $165 just because of the slightly below the expectation subscriptions. However, due to the whole market situation which is bearish for the last couple of weeks, there is a possibility that Disney will let go of some of its heat. If DIS will fail to keep the nose above the $165 then we can potentially see the $145-147.

where to buy DIS? Buy now? NOPEHey friends. What about $dis
For me 130-136 and 115-120 are interesting buy zones.
Good opportunity for open short after wall street lunch time!

perfect summertime setupbought a small position into weakness on this in the pre. Selling once it rips about 5% above it 200DMA, or possibly higher depending on how the overall DOW 30 trades going into June. Considering loading up additional shares into weakness again; we'll see images of massive unmasked crowds at the parks on the news. Euphoric pent up demand to get out to the theme parks will probably drive this to ATH. Disney+ subs will still increase going into fall, but movie theatres are game-on now, especially the joints that serve food & beer direct to your seat. Hiatus is back off.

DIS: Correction is far from over. DIS might actually go back to its pre-COVID prices because that's where it belongs. We had a good run with it since March but the fun is over and inflation is not kidding with overpriced tickers. Although, this might retreat before the main action to make a H&S before it goes down. Of course, Disneyland is going be more profitable for the next quarter but for the time being, this might break below it's trendline and find its sweet spot somewhere above the target before the next earning.

DIS trenline bounceDIS could be rejecting this trendline and making a move to the upside
good R:R
But ER this week. Always a gamble

DIS possibly big moveWe might see DIS make a big move for its earnings this week. I am probably going to play some Straddle plays here.

DIS ER Run Up!$DIS 4HR Chart ...
FA & TA
After a stunning growth in Disney's Disney+ subscription, surpassing just over 100 Million subscribers from its 2019 launch, what more does Disney have in-store? It is evident with vaccines rolling out and states changing public health & safety mandates, people are itching to get out and enjoy in-person activities. This has caused streaming services to take a hit, such as $NFLX as they only harbored nearly 4 million subscribers (2 million less than expected). Luckily for Disney investors, we can hope to see some positive insight with Disney Parks and Cruises. Although cruises are still halted, some parks have been open with Covid restrictions, so perhaps this may the first step on the track to profitability. For potential new investors, the current price may be less attractive due to it still being near ATHs, so it's possible we see some selling pressure to see 158-170 price levels (discount, BUY!) for long term buyers to flourish in. It would be wise to sit sideline and let this upcoming earnings give some direction... Now, DIS has been consolidating within a price range of 178-191 for the past month and with earnings coming up this can potentially see some strength to breakout the current descending triangle. Over 190.50 would indicate some strength and a reversal to retest ATH. However, there is still some downtrend resistance to clear, so we could see a rejection/ false breakout over that resistance line (orange) and head down to 178.70-179 level. Under 178 would invalidate this idea.
Initial Entry: 185
Breakout Entry: 190.50
Target: 195+
Contract Ideas DT/ SW
DIS 185C 5/14| 5/21
DIS 190C 5/21
DIS 195C 5/21


$DIS Pre Earning. Can we see 217? Tight consolidation Nice swingKey of current consolidation at 188 - bullish above it- bearish below it - Its look's like will have +/- 10%-15% move from current tight trades into few sessions (before/after) earning report!. will ER will justify moving up toward 197 then 217 or will be disappointing and falling to 170-150-135 levels.. worth to watch!


$DIS, May 2021On 3 moth chart, squeeze right now, break out soon. 5 day chart, using Fib Tool to check resistance, predict consolidation to at 182 and break out to 184. Bullish confirmation in MACD with crossing. At open will need another confirmation with 9 day EMA crossing middle Bollinger Band for a entry point. Stop loss set at 180. Exit at 184.

Lets Hope Disney doesn’t break that cloud for you bullish folksNYSE:DIS
I want to be bullish but algos bring it down every May. Would think Disney + would change that I guess not. Risky play here

disney--> time to get outDisney is showing bearish divergence. If there is bearish engulfing on weekly then it can go down
hope you are enjoying my analysis, ideas here are for entertainment and education these are not trading advice

DIS - updated idea Wave 4 (blue) might ended on 21 Apr and wave 5 impulse upward might be underway.
Confirm wave 5 once price above190.40.
First target : 200.60 (recent high )

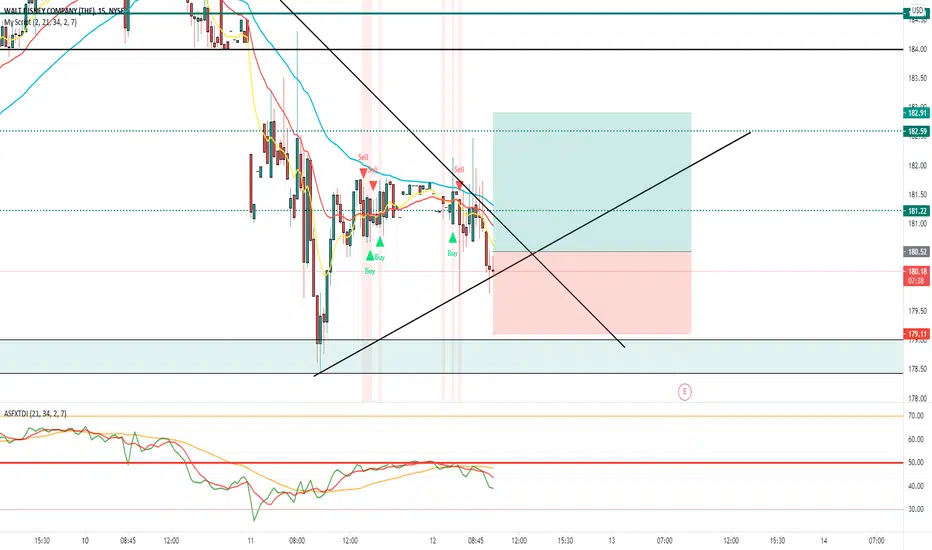
Traditional|DIS|Long and shortLong and short DIS
Activation of the transaction only when the blue zone is fixed/broken.
The author recommends the use of anchoring fixed the blue zone, this variation is less risky.
If there is increased volatility in the market and the price is held for more than 2-3 minutes behind the activation zone after the breakdown, then the activation of the idea occurs at the prices behind the activation zone.
Working out the support and resistance levels of the consolidation zone.
* Possible closing of a trade before reaching the take/stop zone. The author can close the deal for subjective reasons, this does not completely cancel the idea and is not a call to the same action, you can continue working out the idea according to your data, but without the support of the author.
+ ! - zone highlighted by the ellipse is a zone of increased resistance, in this area there is a possible reversal for a correction, please take this factor into account in this transaction.
The "forecast" tool is used for more noticeable display of % (for the place of the usual % scale) of the price change, I do not put the date and time of the transaction, only %.
The breakdown of the upper blue zone - long.
Breakdown of the lower blue zone - short.
Working out the stop when the price returns to the level after activation + fixing in the red zone.
Blue zones - activation zones.
Green zone - take zone.
Red zone - stop zone.
Orange arrows indicate the direction of the take.
Red arrows indicate the direction of the stop.
Priority - The value of the priority parameter implies the author's subjective opinion about the more likely activation zone on this idea, this does not mean that this idea will be 80% activated by this parameter, the purpose of the parameter is to provide for the risk of the inverse of the zone parameter.
Example: "Priority Long: So the author inclines more in the direction of the activation zone open long trades, in this case, when reaching the activation zone in short you should be very careful, because this area may be highly likely to be punched about the breakdown/do not get to take/activate transaction from go to stop."
Please consider this parameter if you use my ideas.
SUM PNL: This parameter displays the total % of all closed ideas of the "new" format (according to the author) for this sector at the time of publication of the idea. The calculation is very "clumsy" just the sum of the profits of all the ideas, based on this indicator, you can more accurately assess the risks when working with my ideas of this sector. I present you the construction of the idea, you can use it yourself as you like based on your subjective view and risks, the calculation of the PNL indicator is carried out only on transactions that the author closed on TV in manual mode or by take.
P.S Please use RM (risk management) and MM (money management) if you decide to use my ideas, there will always be unprofitable ideas, this will definitely happen, the goal of the system is that there will be more profitable ideas at a distance.
