SHOP trade ideas

SHOP - Reversal Time by Inverted Head and Shoulders?NYSE:SHOP has been down 87% from its highest peak at $ 176.29 per share to $ 22.63 in a year (lowest price at $ 22.63 was hit on W1 Oct 2022.
In Weekly chart, Shopify seems going to form an Inverted Head and Shoulders with estimated neckline at $ 44.50.
Even though it is still uncertain whether it will form that pattern or not.
But, if we take a look at another Indicator, say Stochastic:
The shape of the stochastic curving pretty good with a potential Golden Cross above the value of 50 (which i consider one of the best opportunity for swing entry if you have a correction followed by Golden Cross of Stochastic above 50).
If this week confirm that the Stochastic %K is crossing up Stochastic %D, I believe that the price will continue breakout the neckline.
Last Day candle was breaking out the EMA200 (4H Chart):
If you do not wish to wait the confirmation in the weekly timeframe as I mentioned above, you can use the EMA200 (4H Chart) as your stop loss target.
My preferred last support will be the Quarterly CPR with $34.35 - $34.59 range.
Happy Trading!
Disclaimer is always ON.
Currently I do not have possession of NYSE:SHOP stock in my portfolio.

SHOP, 10d+/-31.81%falling cycle -31.81% more than 10 days.
==================================================================================================================================================================
This data is analyzed by robots. Analyze historical trends based on The Adam Theory of Markets (20 moving averages/60 moving averages/120 moving averages/240 moving averages) and estimate the trend in the next 10 days. The white line is the robot's expected price, and the upper and lower horizontal line stop loss and stop profit prices have no financial basis. The results are for reference only.

Smile it's going to be a NEW YEAR!Happy New YEAR! Let's bring in the new year with an inverted head and shoulders! Let's hope we break out of the downward channel to come up and at least test the shoulder line. Then to top off are 2023 year we hope to breakout of the BIG SMILE this chart has giving us. GL to all and hope your trading for '23 is spectacular.

Potential $shop swings if it gets to the $30 zone$shop is currently forming a very clean inverse head and shoulder pattern that lines up with the .707 fib retracement on the daily/weekly timeframes. If we get to that $30 level, I'll be watching for a hold and signs of reversal.

SHOP Bye ByeLooks like SHOP is breaking down from this Head and Shoulders Pattern here.
Send it down to the bottom of this channel!

SHOP ANALYSISHello ladies and gentlemen, according to my graphical analysis of SHOP stock, we note that since MAY 12,2022, SHOP has entered in a Trading Range Zone until today, I recommend to avoid the sell of this stock at the present time, and if even a break in the resistance level , I would recommend to keep this stock in portfolio.

Shopify: Shop until you drop 🛒Shopify is currently on the verge of dropping further South to complete the turquoise wave B in the middle of the turquoise target zone between $34.35 and $28.22 before turning the course back North to exceed the resistance line at $45.43 in order to complete the pink wave (A). Our alternative scenario implies an earlier surpassing of the $45.43-mark instead of dropping into the turquoise target zone.

Way oversold, not too late to enter! TSX:SHOP is looking excellent for further upside. As inflation continues to drop, expectations for rising rates will also continue to drop. This is bullish for high growth stocks like SHOP. We are now above a key level (200 Day SMA), which often is the beginning of a technical bull market. Although I started my position a month ago, this stock is still tremendously oversold on the longer term charts and still has a lot of long-term potential for growth. I believe it's one of the most unfairly treated stocks this year by far on the TSX. The risk/reward looks favourable over the coming weeks and months, and the downside risk is now much lower than when inflation was continuing to climb every month.

SHOP - formed a baseAfter falling more than 80% from it's peak of 176.29 on 19 Nov 2021, SHOP began to range sideways since May 2022, forming a rounded base. There was an attempt break up the neckline @ 45.43 on 11 Aug 2022 but it failed after filling a prior gap that happened on 4th May.
It is now close to making another attempt at breaking up and there is a chance it could stall at the neckline (again). However, now that it is crossing above its 200 day moving average, its odds of breaking up successfully in the near future has increased.
Long the breakup with an initial stop just slightly below it's 20 or 50 day moving average.
Its momentum is strong as long as it continues to trend up along or above it's 20 day moving average.
Disclaimer: Just my 2 cents and not a trade advice. Kindly do your own due diligence and trade according to your own risk tolerance and don't forget that money management is important! Take care and Good Luck!

Shopify breakout long!Shopify looks like it is breaking out of a long-term base, this is the price action from the TSX, slightly different on the U.S. side. Moved above the 30 week average on very high volume today.


Shopify long and break outThis is an amazing company with an incredible mission, the market cap has shows a trend reversal, which given me the indication that we are getting ready for a new bull run.

Shopify Inc| Bullish Trend | 4 Hr | 25/11/22
Shop is in the bullish trend.
It is not a financial advice.

$SHOP longs beware. Shop to go back to $17-20?$SHOP just formed another lower high which you can clearly see looking at the chart from the daily timeframe. I think we're about to see one more drop from here which bottoms around $17-20.
After it reaches that range, I think that will be the setup for a longer term bounce.
short term to 45 USDweekly falling wedge, weekly RSI divergence, short term back to the starting point of the wedge, 45 USD.

This looks like a very Good ShortYou will find the answers on the Chart.
All those Buyers getting kicked by the Sellers (Wicks).
I am getting ready for a nice Short

SHOPIFY SHORTEasy monetary tightening, also bad fundamentals.
In this environment these types of stocks are going to get even more punished.

SHOP weekly below mean at despair zone of the bubble cycleBuy below $35
Sell Shares of SHOP with a Limit Order (Good 'til Canceled) at $197.87.
SHOP weekly below mean at despair zone of the bubble cycle HODL stop loss $0

SHOP short tradeShort term short trade for shopify.
Short at 36.50 initially potential pull back but higher short at 38-40 will monitor.
It's recently broken out of a descending channel due to earnings. I expect momentum to potentially continue depending as it looks like the indices want to extent a little further before pulling back.
Confluences for trade are:
historically 60-80 RSI has been pullback area for SHOP.
61 FIB is also around this area
Top of recent trading range
20-50 ema may reject again but will monitor. has traded below one another since breakdown at the top.
looking for a 5-10% move to downside back to 32-33 area.

SHOP: that's one bullish move todayWhen two S/R's, each of higher magnitude, get taken out in one day, it makes a statement. Assuming we close above 32.83 (ORANGE), the bulls are set on 38.45 (RED).
S/R's in action.

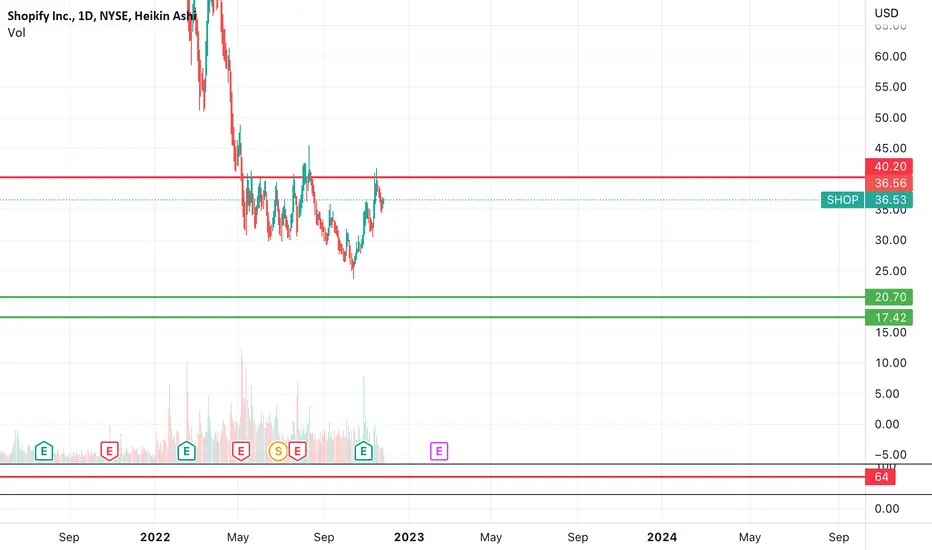
SHOP Shopify simplified Heres my current cheat sheet update for those wanting to trade Shopify and or buy for longer time horizons (investing) instead of trading.
Buy GREEN and Sell RED and ill update its level by level as the stock progresses. With each level you move up just realize that the volatility and RISK increase as well. Should you decide to begin increasing your position size in the RED zones just remember the BIGGER picture.

SHOP monthly bearish hammer retail wave 5 of downtrendSHOP monthly bearish hammer retail wave 5 of downtrend, pretty low, but wave 5 is probably coming. Stop loss above the hammer.
