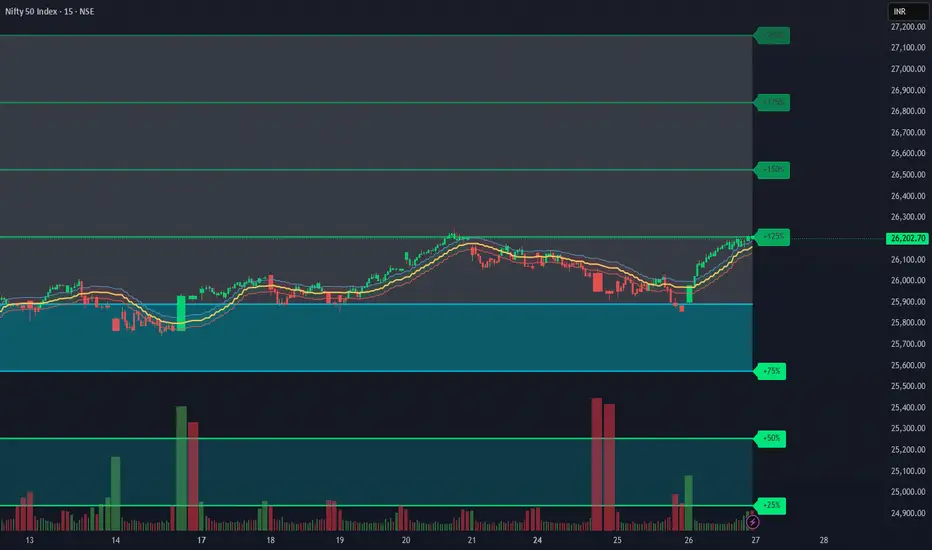
NIFTY Rallied Hard Today…Then Why Did Most Retail Traders Loose?Even though today was a trend day, It was a liquidity trap. Find it weird; continue reading!
Price kept moving up, but it never offered clean structural entry zones. No proper pullbacks, no base building — just continuous pressure upward. That forces traders into chasing or counter-trading, both o
About Nifty 50 Index
NIFTY 50 is the main index for the National Stock Exchange of India (NSE). It tracks the performance of the top 50 stocks by market capitalization from 13 sectors of the Indian economy. With such a relatively small number of companies within the index it still represents over 60% of the free float market capitalization of the stocks listed on NSE, and serves as a benchmark for fund portfolios and index funds. The list of the NIFTY 50 Index constituents is rescheduled every 6 month.
Related indices
nifty 50 - one projection this is one elliott wave idea of nifty 50.
1st nifty can go up as wave c and will complete wave B.
Then it will fall as impulse wave C till 100%-127% level.

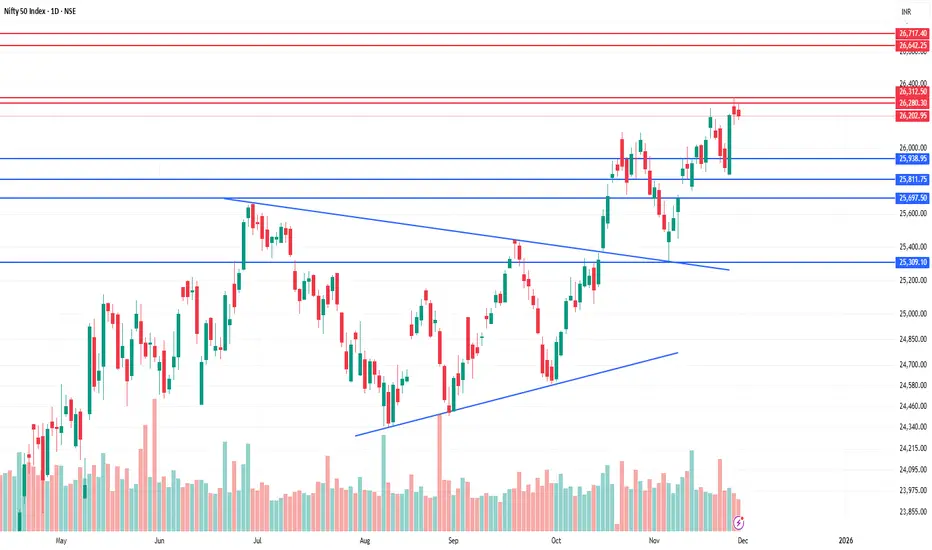
Nifty Weekly Outlook (1st Dec - 6th Dec)Nifty Weekly Outlook
Resistance: 26,310 | 26,450 | 26,650
Support: 25,940 | 25,800 | 25,700
This week, Nifty showed a strong bullish move and even broke its all-time high, reflecting strong momentum and continued buying interest. As mentioned earlier, Nifty remains bullish with no signs of weaknes
#Nifty directions and levels for Nov 27th:Good morning, friends! 🌞
Here are the market directions and levels for Nov 27th:
The global market (based on the Dow Jones) has shown a moderately bullish sentiment,
while the local market is also displaying a moderately bullish tone. Yesterday, the Dow Jones continued its pullback.
However, GIFT

NIFTY50.....Double-top ahead!Hello Traders,
the NIFTY50 closed the week up 158 point or + 0.61%! It also moved into the area of an order-block (OB) and a fair-Value-gap area! This is important to be aware fact this fact, as it could lead to a strong sell-off in the coming days!
But one step at a time!
The N50 create a „double-

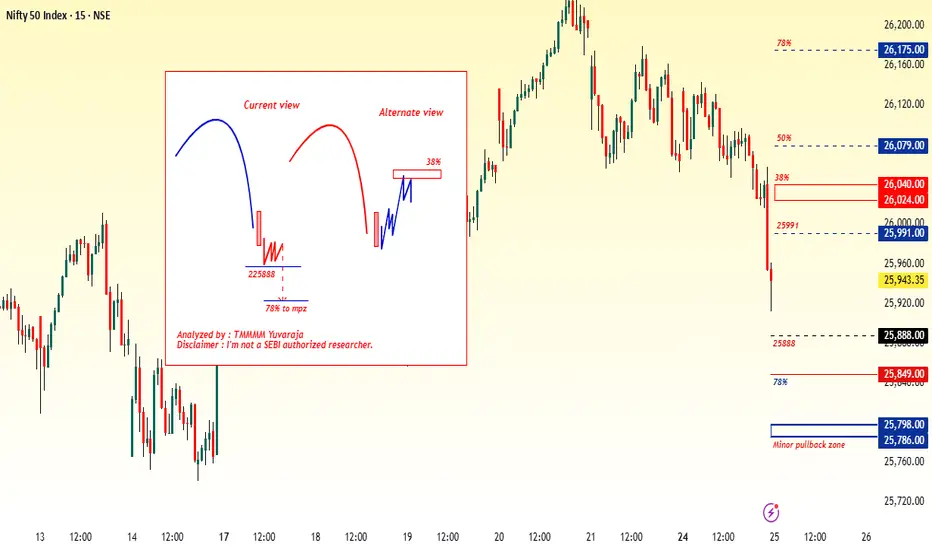
#Nifty directions and levels for Nov25Gift Nifty is showing a neutral to slightly positive start. The structure remains that of a range-bound market.
In the previous session, Nifty and Bank Nifty moved in different directions during the mid-market, but by the end of the day both declined sharply.
What next?
Given the sharp decline, if
#Nifty directions and levels for Nov 26thGood morning, friends! 🌞
Here are the market directions and levels for Nov 26th:
The global market (based on the Dow Jones) has shown a moderately bullish sentiment,
while the local market continues to display a moderately bearish tone. In the previous session Dow Jones took a solid pullback.
Howe
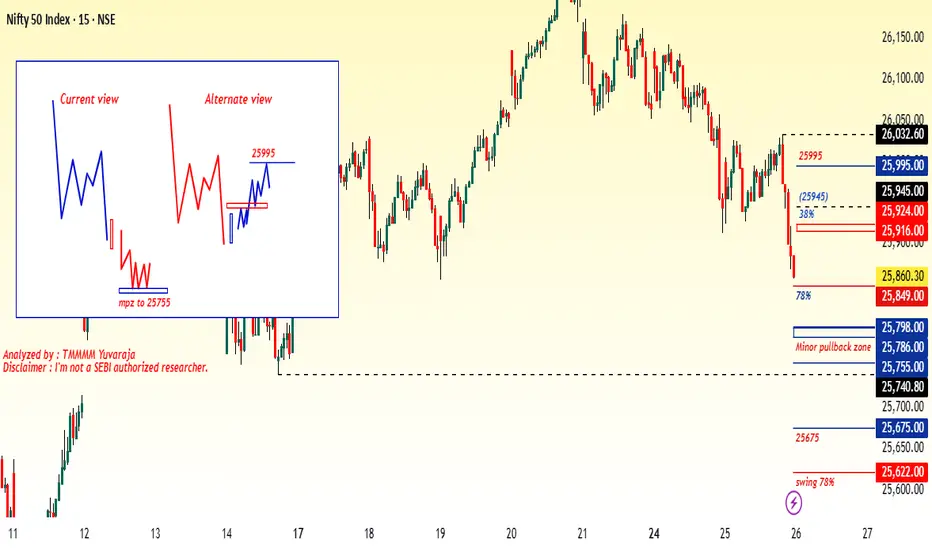
#Nifty directions and levels for Nov 24thGift Nifty is indicating a neutral to slightly positive start. The structure remains of a range-bound market, so until the range is broken, we cannot expect any directional movement. If the price breaks out of the range—either to the upside or downside—then we can follow the direction accordingly

NIFTY Analysis for 25th Nov '25: IntraSwing (Spot)levelsSome Sectoral Indices (Below mentioned) are Nearing Reversal.
NIFTY AUTO: Harmonic BULLISH CRAB in Progress
NIFTY FIN SERVICE: Harmonic BULLISH CRAB
NIFTY IT: Harmonic BULLISH BAT
NIFTY PSU BANK: Harmonic BULLISH CRAB in Progress
NIFTY SERVICE SECTOR: Harmonic BULLISH CRAB
[ Level Interpretati

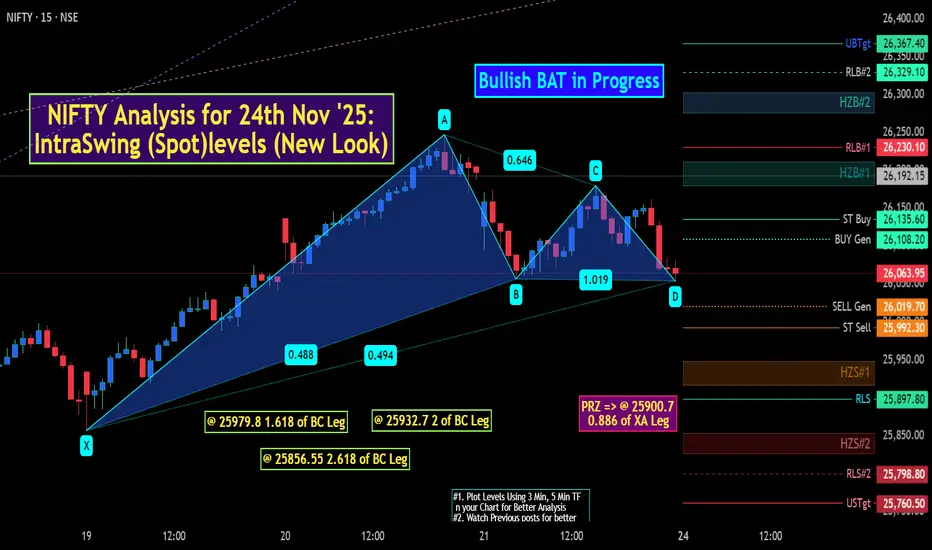
NIFTY Analysis 24th Nov '25: IntraSwing (Spot)levels (New Look)The Bullish Bat pattern is a Harmonic price formation used in technical analysis to identify potential reversal zones where a downtrend may end and a new uptrend could begin. It is defined by precise Fibonacci retracement and extension levels for each leg of the XABCD structure.
Bullish Bat Pat
See all ideas
Summarizing what the indicators are suggesting.
Oscillators
Neutral
SellBuy
Strong sellStrong buy
Strong sellSellNeutralBuyStrong buy
Oscillators
Neutral
SellBuy
Strong sellStrong buy
Strong sellSellNeutralBuyStrong buy
Summary
Neutral
SellBuy
Strong sellStrong buy
Strong sellSellNeutralBuyStrong buy
Summary
Neutral
SellBuy
Strong sellStrong buy
Strong sellSellNeutralBuyStrong buy
Summary
Neutral
SellBuy
Strong sellStrong buy
Strong sellSellNeutralBuyStrong buy
Moving Averages
Neutral
SellBuy
Strong sellStrong buy
Strong sellSellNeutralBuyStrong buy
Moving Averages
Neutral
SellBuy
Strong sellStrong buy
Strong sellSellNeutralBuyStrong buy
Displays a symbol's price movements over previous years to identify recurring trends.
Frequently Asked Questions
The current value of Nifty 50 Index is 26,202.95 INR — it has fallen by −0.05% in the past 24 hours. Track the index more closely on the Nifty 50 Index chart.
Nifty 50 Index reached its highest quote on Sep 27, 2024 — 26,277.35 INR. See more data on the Nifty 50 Index chart.
The lowest ever quote of Nifty 50 Index is 279.00 INR. It was reached on Jul 3, 1990. See more data on the Nifty 50 Index chart.
Nifty 50 Index value has increased by 0.36% in the past week, since last month it has shown a 0.85% increase, and over the year it's increased by 7.95%. Keep track of all changes on the Nifty 50 Index chart.
The top companies of Nifty 50 Index are NSE:RELIANCE, NSE:HDFCBANK, and NSE:BHARTIARTL — they can boast market cap of 237.18 B INR, 173.24 B INR, and 133.93 B INR accordingly.
The highest-priced instruments on Nifty 50 Index are NSE:MARUTI, NSE:ULTRACEMCO, and NSE:BAJAJ_AUTO — they'll cost you 15,900.00 INR, 11,600.00 INR, and 9,073.50 INR accordingly.
The champion of Nifty 50 Index is NSE:BAJFINANCE — it's gained 54.53% over the year.
The weakest component of Nifty 50 Index is NSE:TRENT — it's lost −37.95% over the year.
Nifty 50 Index is just a number that lets you track performance of the instruments comprising the index, so you can't invest in it directly. But you can buy Nifty 50 Index futures or funds or invest in its components.
The Nifty 50 Index is comprised of 50 instruments including NSE:RELIANCE, NSE:HDFCBANK, NSE:BHARTIARTL and others. See the full list of Nifty 50 Index components to find more opportunities.