CEATLTD trade ideas

Ceat for short termTarget : 1440 in short term
It's just a technical analysis and prediction for education purpose.
Keep it on you watchlist or radar.


#CEATA low risk, high reward setup. Trading at its 200EMA at perfect support.
Entered today ~1285
Stoploss below 1100
T1 ~ 1783, then ATH.


Broken Major Resistance-Retest inprogressCeat Analysis:
It is broken major resistance, price is retesting ideal buy area marked on green (Demand Zone)
expecting target 1400. Let's see.
Happy Investing!


BULLISH BREAK OUT IN CEAT TYRESCROSSED PRE-COVID LEVELS LAST WEEK.
WEEKLY RSI crossed level of 60 after 2 yrs.
PLEASE SEE CHART FOR FURTHER DETAILS
TARGET 1: 1200
TARGET 2: 1300
STOP LOSS : 1080
**These are my personal observations. Please trade at your own risk.**

a high probability long opportunity on ceat ltd1)a head and shoulder formation and
2)breakout above a resistance and
3) also forming higher high and lows
4)along with trendline breakout


CEAT ready to hit the road. Looking good !! Accumulate on dips CEAT breakout from the channel, looking to form Header and Shoulders pattern !!
Economy opening up, auto numbers coming out good. Looks to be back on its long run..!! Above 1020 a definite buy for long


Triangular pattern breakout SL posted on chartNSE:CEATLTD
Keep SL at red line, target open for now
Disclaimer: I am not a SEBI register person please contact your financial advisor for advice.

CEAT-Looks bullish but need to break,close above bearish channelMarket Commentary:
LEARNING ELLIOTT WAVES IS LITTLE BIT TOUGH (FOR ME IN BEGINNING) BUT I TOOK IT AS A CHALLENGE AND THAT IS NOT IMPOSSIBLE ALSO...
First have an look for the positional trend i shared here previous....if you are a follower of me...and sometimes i will share the counter trend trade also in 15 mins and 1hr...but that is risky ones...so if the trend is bearish or bullish, if i am expecting the correction...book the profit there and wait the correction to end and again go with the trend....DONT TRADE THE COUNTER TRADE SETUP...you will took loss too...try to identify the short term pull back and the long term pull back after that took small lots in the short term PB with strict stop and go with big lots in the trend side that is long term. I WONT TOOK ALL THE TRADE PLAN SHARED HERE...
Read the market commentary inside the chart what i shared here carefully and try to learn Elliott waves...otherwise its tough to understand the market commentary and my analysis. I wont give a entry, stop loss and take profit in my chart...it is only for EDUCATIONAL PURPOSE and i am sharing how i am analyzing the pair and labeling them according to the Elliott wave theory...I AM JUST SHOWING THE TREND HOW IT MAY GO AND MY VIEW(it may wrong too)..so DON'T FOLLOW BLINDLY MY CHART..take this as a reference and if it correlate to you strategy took the trade as per your strategy...DON'T ASK ABOUT YOUR RUNNING TRADES i wont comment on them and I WONT SUGGEST TO TAKE MY TRADE SETUP.
My style of trading is different from others and I WONT PLACE A STOP...but ALL MY TRADES ARE UNDER MONEY MANAGEMENT ACCORDING TO MY ACCOUNT SIZE...i wont close the trades even in the BIG NEWS EVENTS OR SCHEDULED NEWS TOO...i am technical analyst based on trendline, channel, fib retracements, expansion, stochastic for divergence, EMA's and MA's are finding the pull backs and MAJOR IS ELLIOTT WAVES...those mentioned past are using as a TOOLS only. I am not a fundamental, sentimental trader...but only the fundamental will boost my technical analysis to reach my target or sometimes it will go against me and then i will manage the trade according to the Elliott waves alternate views...
Each and every trade plan i am sharing here has a alternate view and i am sharing only the most probabilities(70-80%) here...sometimes the other (20-30%) may market do..then i will change the wave counts and labeling according to the price action. All labeling and wave counts done by me by manually and i will keep change according to the LIVE MARKET PRICE ACTION. So dont bias, hope on my trade plans...try to learn and make your own strategy...Following is not that much easy...I AM NOT RESPONSIBLE FOR ANY LOSSES IF U TOOK THE TRADE ACCORDING TO MY TRADE PLANS....THANKS LOT..CHEERS

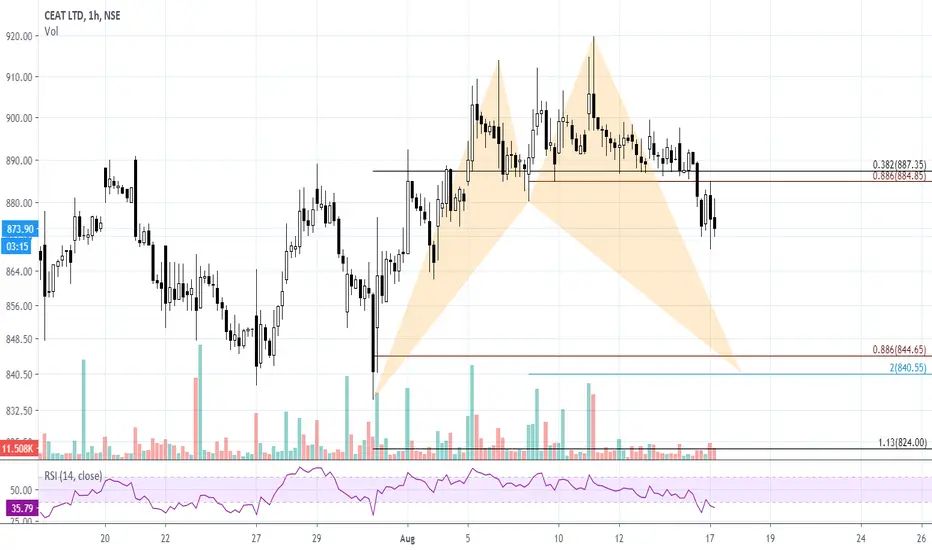
CEAT heading towards 840 - SHARK PROBABILITYprices sustaining below 890 can tale stock towards 840 levels.