Nifty 50 Technical Analysis: Simple Breakdown for September 2025As of September 23, 2025, the Nifty 50 index, the benchmark for the Indian equity market, stands at approximately 25,200, reflecting a marginal dip of around 0.08% in the latest session.
EMA: Checking the Trend Direction
Exponential Moving Averages (EMAs) help us see if the market is going up or d
About Nifty 50 Index
NIFTY 50 is the main index for the National Stock Exchange of India (NSE). It tracks the performance of the top 50 stocks by market capitalization from 13 sectors of the Indian economy. With such a relatively small number of companies within the index it still represents over 60% of the free float market capitalization of the stocks listed on NSE, and serves as a benchmark for fund portfolios and index funds. The list of the NIFTY 50 Index constituents is rescheduled every 6 month.
Related indices

NIFTY50.....Impulsive vs corrective? The facts!Hello Traders,
the NIFTY50 closed the week with a gain of213 points or 0.85%!
So the structure of the waves has become more clear as it has been in previous weeks.
I have switched my count from corrective to impulsive, and with the "tailwind" of the rate cut by the FED, the market will become clear

Nifty Analysis EOD – September 19, 2025 – Friday🟢 Nifty Analysis EOD – September 19, 2025 – Friday 🔴
Flat Open, Sharp Fall, and a Range-Bound Trap
🗞 Nifty Summary
Gift Nifty hinted at a 50-point gap down, but Nifty opened nearly flat at 25,410. However, the bulls couldn’t hold, and within the first 45 minutes, the index slipped 132 points, bre

Nifty Rides 3-Week Rally, Faces Tough Resistance AheadThe Indian benchmark indices extended their rally for the third week in a row, reinforcing the ongoing bullish sentiment.
From a technical perspective, Nifty is trading just below its long-term trendline resistance, where it recently lost some steam. Immediate support lies in the 25,200–25,300 zone

Nifty 50 at a Turning Point? Key Levels & Market Outlook AheadThe Nifty 50 ended the week at 25,327.05, gaining +0.85%.
Key Levels for the Upcoming Week
Price Action Pivot Zone:
25,248 to 25,407 – This range is crucial for identifying potential trend continuation or reversal. A move outside this zone could set the directional tone for the coming sessions.
S

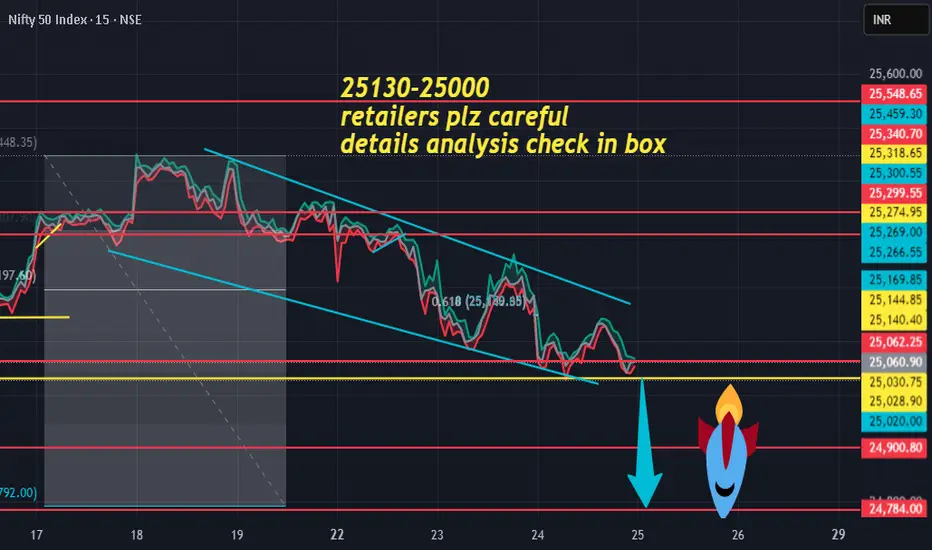
nifty setup for 25/sept/2025past setup was hit .
25130-25000 range .
nifty is running on downtrend .
25130 above 25200/25300
25000 is break than possible points 100+
25000 below tgt -25900/25800
dear traders dont getting trapped ,wait for levels
than go ahead .
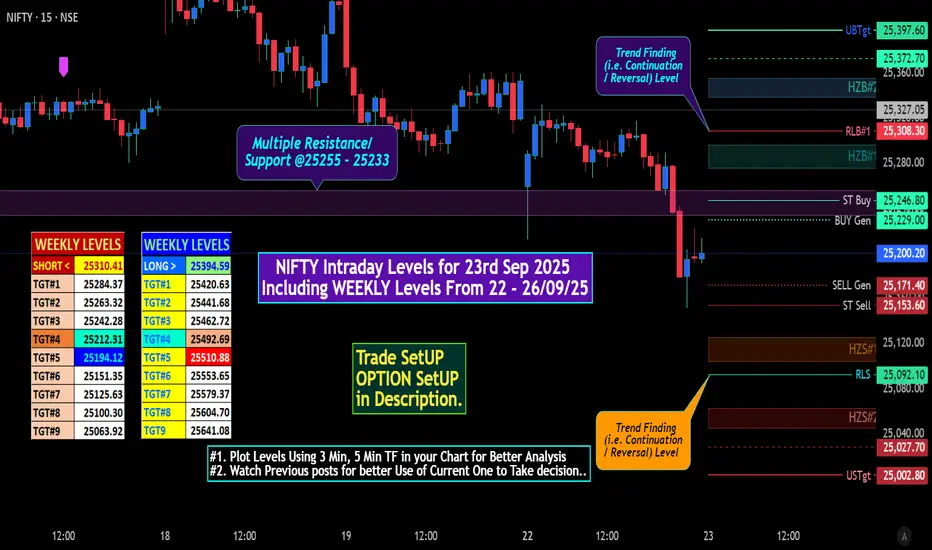
NIFTY Intraday Levels for 23rd Sep 2025NIFTY Intraday Levels for 23rd Sep 2025
Key Takeaways:
• Immediate Action: Watch the 25,154 - 25,308 range. The breakout/breakdown from this band will dictate the next immediate move.
• Warning Sign: The lower high at ~25,331.7 is the most significant technical red flag for the short-term bullis
Nifty levels - Sep 22, 2025Nifty support and resistance levels are valuable tools for making informed trading decisions, specifically when combined with the analysis of 5-minute timeframe candlesticks and VWAP. By closely monitoring these levels and observing the price movements within this timeframe, traders can enhance the

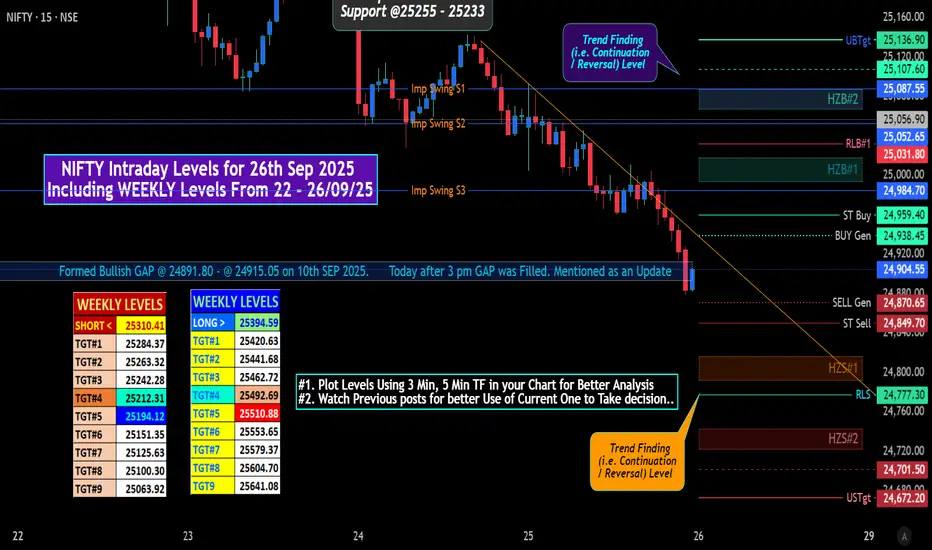
NIFTY Hourly Analysis & Intraday Levels for 26th Sep 2025NIFTY Intraday Levels for 26th Sep 2025
NIFTY — 1-hour technical read
Short version — Structure & Bias
• The 1-hour structure has flipped from a clean rally (early Sep → 17–18 Sep peak) into a short-term downtrend ( mentioned on 19th Sep 2025 POST ) : lower highs after the mid-Sep peak and a s
NIFTY Analysis 21-Sep-2025: BIGGER PICTURELTP 25327
Supports: 25153/24337
Resistances: 25450/25670/26278
As long as 25153 holds support, we can see 25721 first.
Further new ATH and ultimate destination towards 28477 in the coming months/years.

See all ideas
Summarizing what the indicators are suggesting.
Oscillators
Neutral
SellBuy
Strong sellStrong buy
Strong sellSellNeutralBuyStrong buy
Oscillators
Neutral
SellBuy
Strong sellStrong buy
Strong sellSellNeutralBuyStrong buy
Summary
Neutral
SellBuy
Strong sellStrong buy
Strong sellSellNeutralBuyStrong buy
Summary
Neutral
SellBuy
Strong sellStrong buy
Strong sellSellNeutralBuyStrong buy
Summary
Neutral
SellBuy
Strong sellStrong buy
Strong sellSellNeutralBuyStrong buy
Moving Averages
Neutral
SellBuy
Strong sellStrong buy
Strong sellSellNeutralBuyStrong buy
Moving Averages
Neutral
SellBuy
Strong sellStrong buy
Strong sellSellNeutralBuyStrong buy
Displays a symbol's price movements over previous years to identify recurring trends.
Frequently Asked Questions
The current value of Nifty 50 Index is 24,781.10 INR — it has fallen by −0.59% in the past 24 hours. Track the index more closely on the Nifty 50 Index chart.
Nifty 50 Index reached its highest quote on Sep 27, 2024 — 26,277.35 INR. See more data on the Nifty 50 Index chart.
The lowest ever quote of Nifty 50 Index is 279.00 INR. It was reached on Jul 3, 1990. See more data on the Nifty 50 Index chart.
Nifty 50 Index value has decreased by −2.62% in the past week, since last month it has shown a −0.63% decrease, and over the year it's decreased by −4.71%. Keep track of all changes on the Nifty 50 Index chart.
The top companies of Nifty 50 Index are NSE:RELIANCE, NSE:HDFCBANK, and NSE:BHARTIARTL — they can boast market cap of 210.77 B INR, 164.34 B INR, and 123.80 B INR accordingly.
The highest-priced instruments on Nifty 50 Index are NSE:MARUTI, NSE:ULTRACEMCO, and NSE:BAJAJ_AUTO — they'll cost you 16,269.00 INR, 12,141.00 INR, and 8,842.50 INR accordingly.
The champion of Nifty 50 Index is NSE:EICHERMOT — it's gained 44.01% over the year.
The weakest component of Nifty 50 Index is NSE:INDUSINDBK — it's lost −48.91% over the year.
Nifty 50 Index is just a number that lets you track performance of the instruments comprising the index, so you can't invest in it directly. But you can buy Nifty 50 Index futures or funds or invest in its components.
The Nifty 50 Index is comprised of 50 instruments including NSE:RELIANCE, NSE:HDFCBANK, NSE:BHARTIARTL and others. See the full list of Nifty 50 Index components to find more opportunities.