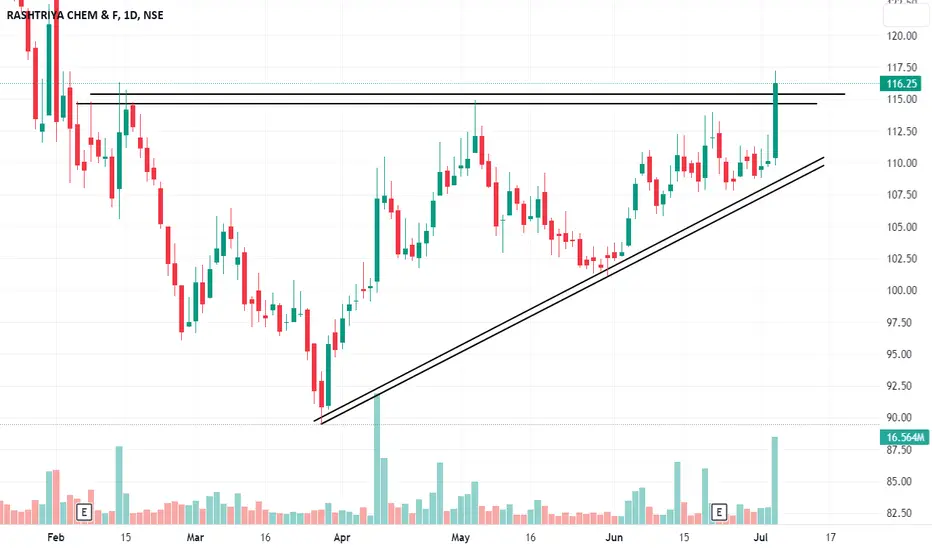
SWING IDEA - RCFMACD Cross is in play.
Volume has increased a lot this week.
1Y Beta is @ 1.78, which is very good for this stock.
This week could be your Entry week if stock retest levels mentioned on chart. Good change it might too.
Overall looks good till Swing High.
RCF trade ideas

RCF BRAKEOUT ON DAILY CHARTNSE:RCF
RCF gives double brake out daily chart.
Buy price 154
Sl 140
Target 185

Trendline Breakout RCF ready to break the trendline on weekly chart if closes above 163. Short term targets will be 170,185,190. Keep in radar. Entry only if weekly closing above 163.

RCF BUYRCF BUY VIEW
TRADE REASON :
1)MONTHLY - Uptrend Correction Completed
2)DAY - Trend Reversal
Entry - 147.50 Rs
Target - 180.95 Rs
Stoploss - 118.40 Rs
Happy Trading .

Elliot's impulsive 5-wave formation with trendline support #Freshview Dt 25.04.2024
#RCF CMP 150+
Weekly chart
Elliot's impulsive 5-wave formation with trendline support
Accumulate in SIP
Price Momentum
120-136-152-164-186-216-230+
Hope for the best.
Stay Connected
#TEJGYAN

Swing and positional trade (educational prupose only)Stoc has given multiyear break out and now restesting its breaout on monthly time frame.
For positional trade : target could be as high as 50 to 60% ( beware it will not go up in straight line, ther will be ups and downs)
For Swing : Target around 200 approx
Two ways to plan trade :
1 stock has given 50 EMA breakout and retested level. You can buy at high of retest candle
2. Its following upword channel and currenly at bottom of the channel. Target could be arounf 200 (upper intersection of the channel)
Please do your own due diligence. Cheers !!!

RCF - GO LongCompany has given the Monthly and Weekly BO and is ready for the further momentum. Stock can be traded based on swing analysis. Fundamentals are ok not like Deepak Fertilizer

RCF MONTHLY CHARTRCF MONTHLY CHART
Ellipse breakout @ 133 MOB 225-235
This stock has broken out of its monthly ellipse @ 133, Target projected as seen by MOB.
Note : Ellipse is calculated by combination of technical studies. MOB levels too are technical studies.
Its only an observation & not any suggestion.

15 years breakout#RCE
• monthly chart analysis
• budget session: this stock is in focus
• breakout 2008 high level
• 15-year breakout in chart
• 2008 volume build-in chart but global crisis hit stock badly
• ascending triangle pattern breakout
• 2022-2023: massive volume in chart
• this volume helps to breakout chart 🐂
• Target and Stop losses mentioned in chart
• we never recommend buying and sell any charts and this stock is also
• More, please check the chart all mentions in that

RCF Ready to Rally?Simple analysis No Confusion! I have marked levels and targets on charts and i hope they are self explanatory, looking at the volume build up in this scrip it should easily close above 151.95(monthly time frame candle).
Looking at the financials of this scrip, RCF had significantly reduced their Debts from past few years, this looks very attractive for investors and as per price action and Volume build up this stock and easily rally above the levels marked in the chart, its looking good for short term investment for a period 1 to 1.5 years.
Analyze as per your view and invest accordingly for best returns.

rcf Indian government seeks parliament's approval to spend additional 133.51 billion rupees ($1.60 billion) for fertiliser subsidy for current fiscal year
** Additional fertiliser subsidies to raise the total subsidy for fiscal 2024 by 8% year-on-year to 1.88 trillion rupees
** Rise in subsidy will likely help fertiliser companies' volume growth


RCF SWING TRADE IDEARCF ascending broadening channel and all time high breakout done today with strong bullish candle and gud volume bar can play this for swing trade with gud RR.

RCF SWING TRADE IDEARCF gave aits all time high breakout today with gud volume bar as well as strong bullish candle can plan for swing trade with RR.

RCFSeeking a breakout spanning multiple years, I'm fully committed to this opportunity. Anticipate potential movements commencing today, and the probable movement dates are also mentioned in the chart
First installment now and the second immediately after it breaks out of the trendline
SL below 130

Rashtriya Chemicals & Fertilizers Ltd
Breakout after long consolidation - Stop Loss @108 - Target open to sky
FUNDAMENTALS
Market Cap
₹ 7,572 Cr.
Current Price
₹ 137
52 W High / Low
₹ 146 / 89.5
Stock P/E
17.7
Book Value
₹ 85.3
Dividend Yield
3.87 %
ROCE
21.2 %
ROE
21.2 %
Face Value
₹ 10.0
Promoter holding
75.0 %
EPS last year
₹ 17.5
EPS latest quarter
₹ 0.92
Debt
₹ 2,298 Cr.
Pledged percentage
0.00 %
Net CF
₹ -1,088 Cr.
Price to Cash Flow
9.62
Free Cash Flow
₹ 402 Cr.
Debt to equity
0.49
OPM last year
6.91 %
OPM 5Year
6.96 %
Reserves
₹ 4,155 Cr.
Price to book value
1.60
Int Coverage
4.03
PEG Ratio
0.28
Price to Sales
0.40
Sales growth 3Years
30.3 %
Profit Var 3Yrs
48.6 %

RCFPSU Fertilizer sector on radar ⚡
Buy at 131 level huge volume seen in fertilizer sector
Target 146 +

Rashtriya Chemicals and FertilizersKeep an eye on NSE:RCF
Stock approaching buy zone for correction.

RCF WITH LOW RISK ENTRY WITH MAX REWARD Breakout trading implementation:
1. **Identifying New Trends:** Breakout trading helps traders identify the beginning of new trends by focusing on price levels where an asset breaks out of its historical trading range.
2. **Volatility Indicator:** Breakouts often occur when there's increased volatility in the market. Monitoring breakouts can provide insights into shifts in market sentiment and potential price movements.
3. **Entry Points:** Breakout points serve as potential entry points for traders looking to ride the momentum of a newly established trend. Buying on a breakout can capture the early stages of a price movement.
4. **Confirmation of Strength:** Successful breakouts indicate the strength of a trend. If an asset breaks out with high volume and follows through with sustained price movement, it suggests a strong trend in that direction.
5. **Avoiding False Signals:** Breakout strategies often include using indicators or confirmation signals to avoid false breakouts. This can enhance the accuracy of trade decisions.
6. **Defined Risk and Reward:** Breakout trading allows for setting clear stop-loss levels below the breakout point, which helps manage risk. Traders can also calculate potential profits based on the distance between the breakout point and a projected target.
7. **Adaptable to Various Markets:** Breakout trading can be applied to various markets, including stocks, forex, commodities, and cryptocurrencies. The concept remains consistent across different assets.
8. **Flexibility:** Traders can adapt breakout strategies to their preferred timeframes, whether they are day traders, swing traders, or long-term investors.
9. **Liquidity Opportunities:** Breakout points are often associated with increased trading volume, which can provide better liquidity for executing trades.
10. **Risk vs. Reward Assessment:** Traders can evaluate the potential risk of a trade (stop-loss) against the potential reward (target price), aiding in decision-making and portfolio management.
11. **Psychological Advantage:** Successful breakout trades can boost a trader's confidence and discipline, reinforcing the effectiveness of their strategy.
12. **Market Events:** Breakouts can occur around significant market events such as earnings reports, economic data releases, or geopolitical developments, offering traders opportunities to capitalize on sudden price movements.
Remember, while breakout trading offers potential advantages, it also carries risks. False breakouts and market reversals can lead to losses. Successful implementation requires a solid understanding of technical analysis, risk management, and the ability to adapt to changing market conditions.

RCF start to ready to break 135 level SL 118 DCB RCF trying to give catch up move above 135 once cross and daily clab 135 can go 140-145 cross 145 review more. CMP 126.30 SL 118 DCB FOR 140-145. For more details go through chart.

Rcf previous swing breakout Rcf previous swing breakout
Buy for swing trading
Target for 150 to 160
Stop loss 118
For Everyday Updates follow me.

RCFRCF has successfully achieved a significant breakout of the crucial Gann box levels, convincingly surpassing the downward trendline on a daily basis with considerable trading volumes. The suggested stop-loss (SL) is set at 110, while the targets have been carefully identified using Gann box analysis.

Triangle Pattern BreakoutPlease look into the chart for a detailed understanding.
Consider these for short-term & swing trades with 2% profit.
For BTST trades consider booking
target for 1% - 2%
For long-term trades look out for resistance drawn above closing.
Please consider these ideas for educational purpose