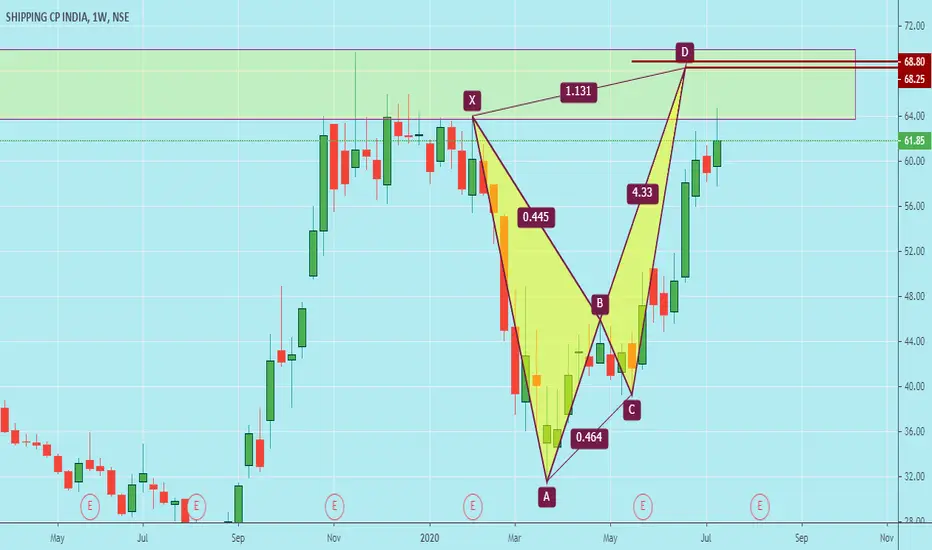
SCI trade ideas


SCI in range of breakout and its ready for breakout with limitedSCI in range of breakout and its ready for breakout with limited risk and higher reward


Drop a follow here: @Hishamudeen✺ Chart Type: Self Explanatorymonthly breakout
*buy at retest level
✺--------------------------- Motivational and psychological area ✺
✣Trade only if you are in the right mindset, if you have been emotionally weak for some time, take your time and don't trade, trade with a happy and + mindset only.
✣If you want to make money, firstly be prepared to lose it, only that much which you can afford and that much by which you can make a mistake again, learn from them and grow
✣Don't lose hope and keep grinding
✣Focus on the process, you are here to make money not stupid decisions, and lose it all
✣No one will help you climb the mountain, few will tell the path, so follow good peoples, make good mentors and make good decisions and choices in the stock market.
✣Believe in yourself :)
✺------------------------------------ Some info-------------------------- ✺
➼My name is hisham and I am a 3rd year Engineering student, I want to pursue trading as my career, and thus whatsoever setups or trades I potentially see on my charting platform, I post it here and share them with you all.
➼I hope you will love my simple analysis style.
➼Feel free to suggest your view on this as learning is earning here :)
➼I take my trades on my Zerodha account :)
➼I don't take all the trades I post
➼These charts are my and only my work, my thought process, just from an educational point of view and no calls.
<<<<<< Thank You Have a Nice Trading Day >>>>>>


SCIIt has made a breakout in higher time frame suggesting further continuation of uptrend. Could be accumulated between 115-130 for upside levels of 175/200/250. View would negate below 105

Service Corporation International Announces First Quarter 2021 FSCI: Service Corporation International
2021-05-03 16:00:00
Service Corporation International Announces First Quarter 2021 Financial Results And Increases 2021 Guidance


SCI Weekly - Re-test after beautiful breakout - Swing TradeThe above analysis is done purely based on price action and chart patterns.
The analysis is done on Weekly TF hence it can take couple of days to couple of weeks/months to reach the target.
Logic as well as the trade setup (Entry, SL and Target) is shown in image itself.
The above analysis is purely for educational purpose. Traders must do their own study before entering into any trade. Traders must trade as per their own risk taking capacity and money management.
Feel Free to comment for any queries regarding the above stock or price action analysis in general.
Also check out my other ideas to understand how price action works and how it can be used to make regular profits without any complex strategies.


BUY SCI (shipping corporation of india) IN WEEKLYwww.tradingview.com
BUY SCI (shipping corporation of india)
PRICE : 93 TO 98
STOP LOSE : 82.3
TARGET : 107, 114, 123

SCI - Daily Elliot Wave AnalysisSCI - Daily
Elliot Wave Analysis
Wave : = 31.45 - 64.75
= 33.3
= 64.75 - 50.05
= 50.05 - 104.30
= (33.3 * 1.618) + 50.05 = 104.3
Wave 4 Possibility = 91.4 **
Wave 5 Possibility = 100 - 104 lvls **
(**) refer notes
Elliot Wave Analysis Notes (**)
There is a likely possibility of wave 5 truncating (Wave 3 = Wave 5) as wave 3 was severe in momentum .
Likely wave 4 is to retrace back to 91.4 for a target of 100 - 104 lvls


Possible Long Opportunity for SCIFollowing is just my thought process. This is in no ways a recommendation. I just want to share and learn!
Kindly Trade at your own risk
Following Reasons for bullish view
1.) Price taking support at Weekly Trendline
2.) Price taking support at weekly HORIZONTAL support zones (Support zone can be found on zooming out the chart to Feb & Nov 16 time frame)
3.) Reducing Bearish momentum noticed by reducing range of the RED candles eventually ending in a long legged doji, possibly indicating exhaustion of sellers
Stop loss = 52.5
Target 1 = At-least 66
Would like to ride the trend by trailing stoploss