Sequent scientificDouble bottom with RSI divergence, expect 13% upside in short term
Reasons:
1. double bottom
2. RSI divergence
3. Health pharma sector showing reversal signs
Note: for learning purposes
SEQUENT trade ideas

Buyit gives trend line breakout
Volumes also looks good
And in higher time frame stock is in uptrend and it retrace till 50% according to fibonnaci and nw its continuing the trend

Looking to go long on SEQUENTCMP of SEQUENT is near the 100 day EMA and also high chance of it taking support from 0.5 level of the fibonacci. Will go long on this one if everything else looks okay


Sequent 09-08-21Sequent making bearish butterfly
Hold till 350 levels
Sell 50 percent quantity at 320 levels
Remaining at 350 levels

Sequent Scientific Consolidating and forming Triangle pattern.Sequent scientific after a good rally. Consolidated and formed a triangle pattern that is getting ready to breakout.
Markets are volatile and any side breakouts are possible but still, chances are sequent scientific will be bullish.
Once a given both Intraday and Positional player can take an entry
For bullish breakout
Target 1 : 284 with SL placed 1 point below the trendline (Can be Achieved in Intraday)
Target 2 : 304 (positional Target) if taken position before trail SL accordingly otherwise it depends where you are taking entry.
For bearish Breakout
There is only one Target not much is looking for.
Target 1 : 253 with SL placed 1 above triangle trendline.


BO from Triangle patternthe stock has broken out of a triangle/wedge pattern with good volumes. targets - 300, 311 are possible.


#SEQUENT_SCIENTIFIC
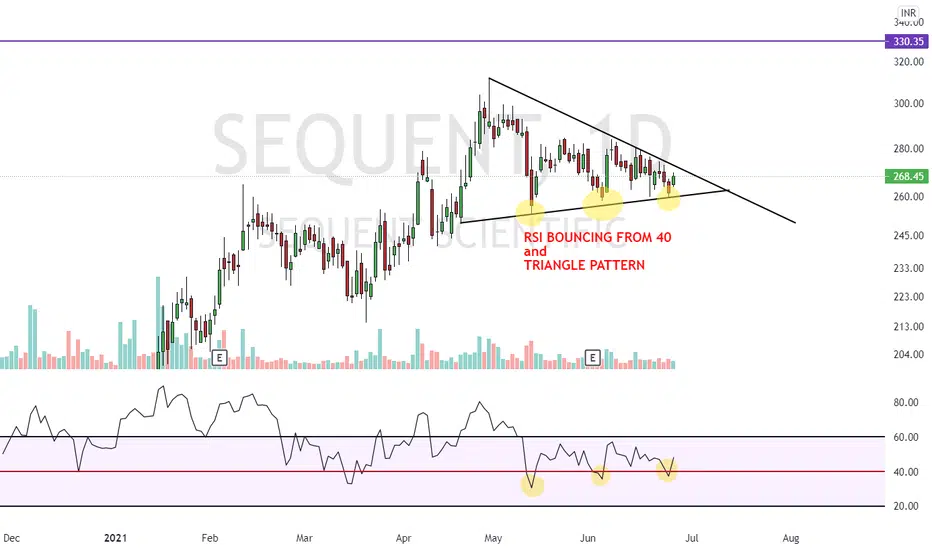
LOOK AT RSI(14) WE CAN SEE A BOUNCE FROM 40 ODD ZONE
ALSO, SYMMETRIC TRIANGLE FORMATION CAN BE SEEN INDICATING A RANGE CONTRACTION.
BREAKOUT FROM THE RANGE CAN SEE A GOOD RALLY TILL 330 LEVELS
VIEW INVALID BELOW 250(DCB)
DISCLAIMER: EDUCATIONAL VIEW
sequent triangle breakout possible!sequent is forming triangle pattern.once it gives breakout go on buy side for target of 10%.

SEQUENT - Symmetrical Triangle + Bullish H&S pattern - SwingThe above analysis is done purely on basis of Price Action & Chart Patterns.
The analysis is done on daily TF hence price may take few days to few weeks in order to reach the targets. Also, the final target is more than 50% from here and thus price may take few months to reach the final target.
Trade setup is explained in image itself.
Also check out the formation of Bullish H&S pattern in hourly Time frame
The above analysis is purely for educational purpose. Traders must do their own study before entering into any trade. Traders must trade as per their own risk taking capacity and money management.
Feel Free to comment or message me for any query or suggestion regarding this stock or Price Action Analysis.
Checkout my other ideas to understand how one can earn from stock markets with simple trade setups.


Sequent ScientificComing out of a VCP or a cup and handle pattern.
Awaiting a breakout.
*****
Help Me to Help Us.
I believe in keeping the chart simple with minimal drawings & easy to interpret.
Always keep a stop loss to rescue you out of troubles.
So kindly express any disagreement & improvements so that we learn & earn together.
Please support the effort and appreciate it with a Like if you felt it deserves it and Following me would only add on to the motivation.


