C trade ideas


$SPY My my! Only a break of 53.30 can lead this market to ATH. But MCD, RSI, Volume have different plans! 43.98 next stop!

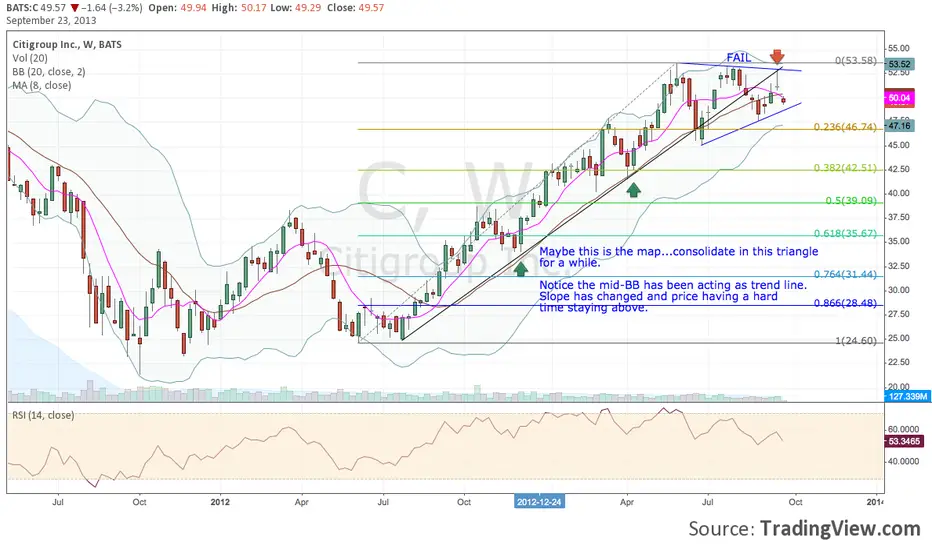
Earnings Prior To OpenSince July 5th 2013 $C has been demonstrating only upside potential, however, with earnings prior to the open Monday the formation has pull-back oppy's too. Hope the sixty works as the initiating candle sets the stage. Sincerely, Beauty


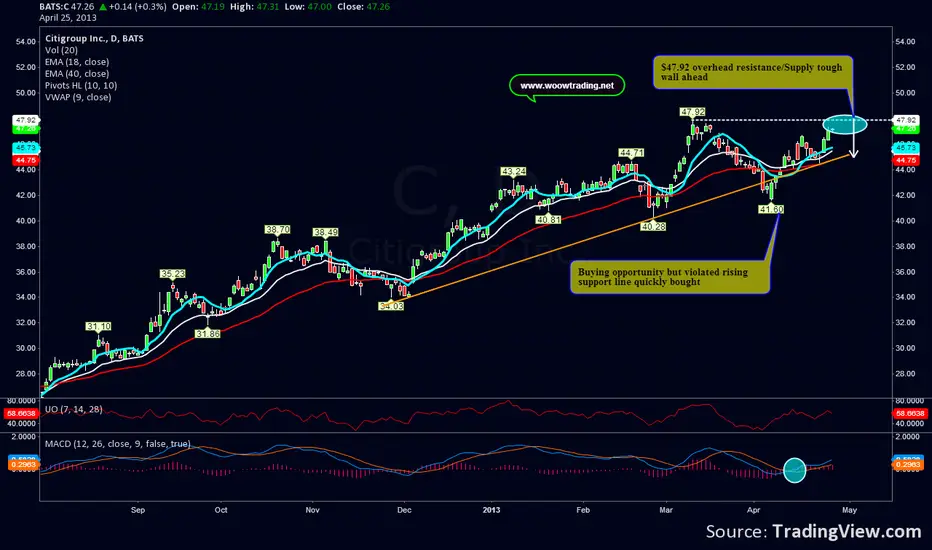
Will $C crash recent swing high?Tough to judge from here, but it could be another shorting opportunity if that fails. Good to take note and see if price finally pushes above recent swing high $47.92 area if not expect another possible violation of the rising support line. Join us woowtrading.net
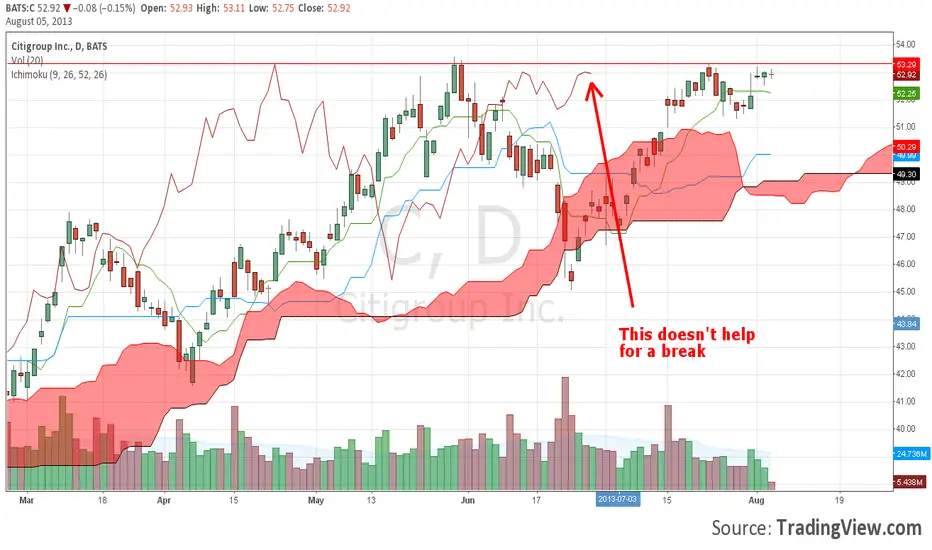
Stage 4 to Stage 5 of Intermarket Analysis, Financials vs BondsCitibank C is the first to report bank earnings Monday April 15 before the market open. If you think bonds might have a chance to break higher and or you believe Citibank might scale down it's 2013 guidance, Friday would be a good time to short the market. If you think bonds are ready to break lower or Citigroup is going to beat analyst expectations, you should stay the course with your long positions; although watch big technology heavy hitters Apple AAPL and Google GOOG, might be a concern the following week.
More to say...
Today's big banks are different than banks of 40 years ago. Big banks such as Citibank are all over the world. Citibank will do very well when China, India, and Brazil's economies start to pick up to near double digit growth, much like before the financial crisis. Many are also worried over the global housing bubble in these developed countries. China's government has attempted several times to slow the housing bubble, but people are still exuberant over buying a house and living the "American dream". The dream might be a nightmare for those who didn't notice what took place in the United States from 2000 to 2008. Americans know the story very well. China will most likely burst next year, but Citi and other mega banks stand to gain profits before the topple.
There has been a strong inverse relationship with banks and bonds over the years. Banks thrive in environments when bonds go down and economies heat up. Unfortunately, however this is often in the latter stages of a business cycle when inflation really starts to pick as well. Right now the US economy is in a slow to steady rise while developed countries have been caught up in a slow down for a year now. The developed and developing world however might be nearing a period of rapid growth.
John Murphy
Intermarket analysis is a branch of technical analysis that examines the correlations between four major asset classes: stocks, bonds, commodities and currencies. In his classic book on Intermarket Analysis, John Murphy notes that chartists can use these relationships to identify the stage of the business cycle and improve their forecasting abilities. There are clear relationships between stocks and bonds, bonds and commodities, and commodities and the Dollar. Knowing these relationships can help chartists determine the stage of the investing cycle, select the best sectors and avoid the worst performing sectors.
Inflationary Relationships

