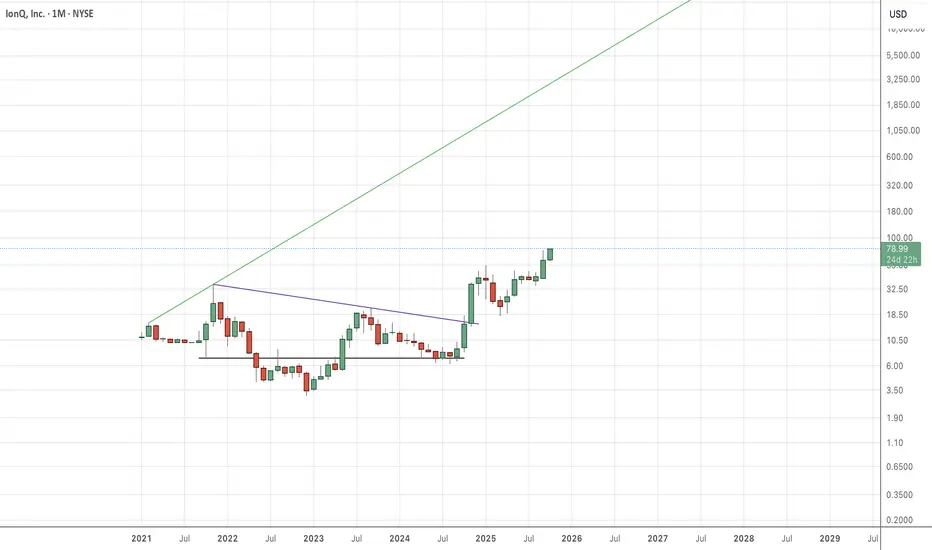
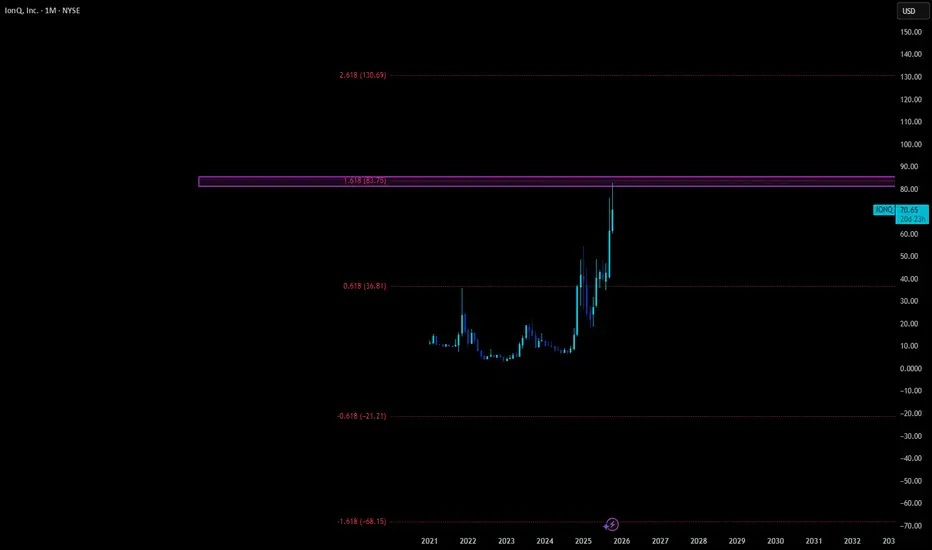
IONQAISP and IONQ are my AI plays. I've been spot on on both of these charts, although it turns out the AISP chart moves slower. It's moving in a much slower and larger formation than IONQ, which means it will run bullish longer, whereas IONQ needs to be watched more closely for a localized peak, whi
Key facts today
Next report date
—
Report period
—
EPS estimate
—
Revenue estimate
—
−2.02 USD
−331.65 M USD
43.07 M USD
282.25 M
About IonQ, Inc.
Sector
Industry
CEO
Niccolo M. de Masi
Website
Headquarters
College Park
Founded
2015
ISIN
US46222L1089
FIGI
BBG00XZP0LB4
IonQ, Inc. develops and manufactures quantum computers. The firm specializes in quantum computing and quantum information processing. The company was founded by Christopher Monroe and Jung Sang Kim in 2015 and is headquartered in College Park, MD.
Related stocks
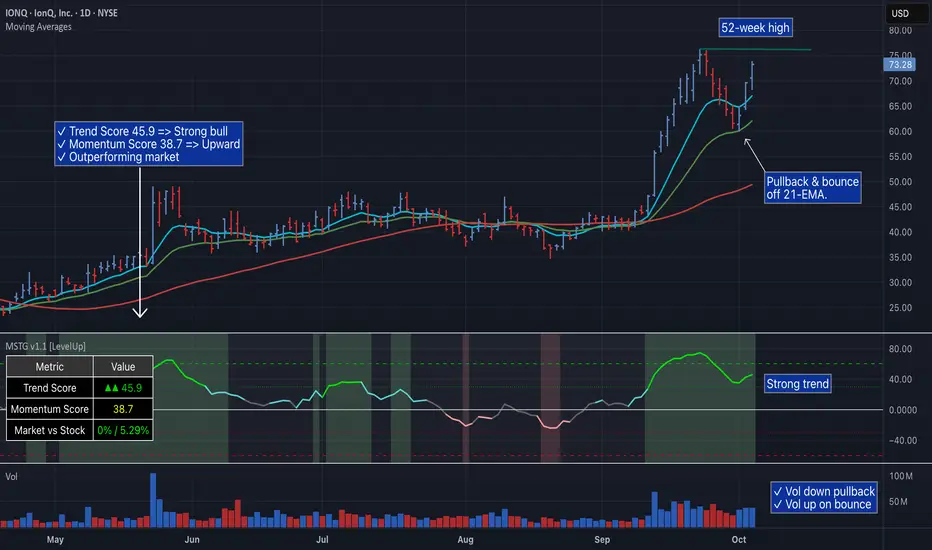
IONQ’s Next Move: $75 Breakout or Another 21-EMA Support Test?IonQ (IONQ) showed strong performance this week, hitting new highs and maintaining bullish technical ratings as sector momentum continued and news of strategic investments boosted sentiment.
The company traded near its 52-week high at around $73.54, up over 70% year-to-date, and benefited from its
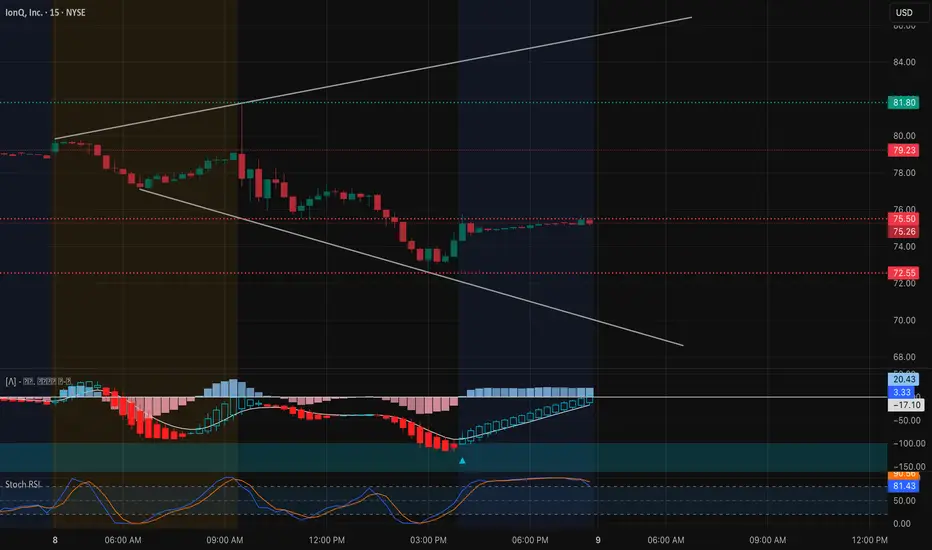
IONQ Oct. 9 — Bulls Building Base Near $72Breakout Watch Toward $79–$81 🚀
IONQ has been stabilizing after a steep pullback, currently forming a base around the $72–$75 range inside a descending channel. The 15-minute chart shows a clear CHoCH pattern signaling a shift in short-term structure as price rebounds off the lower channel boundary
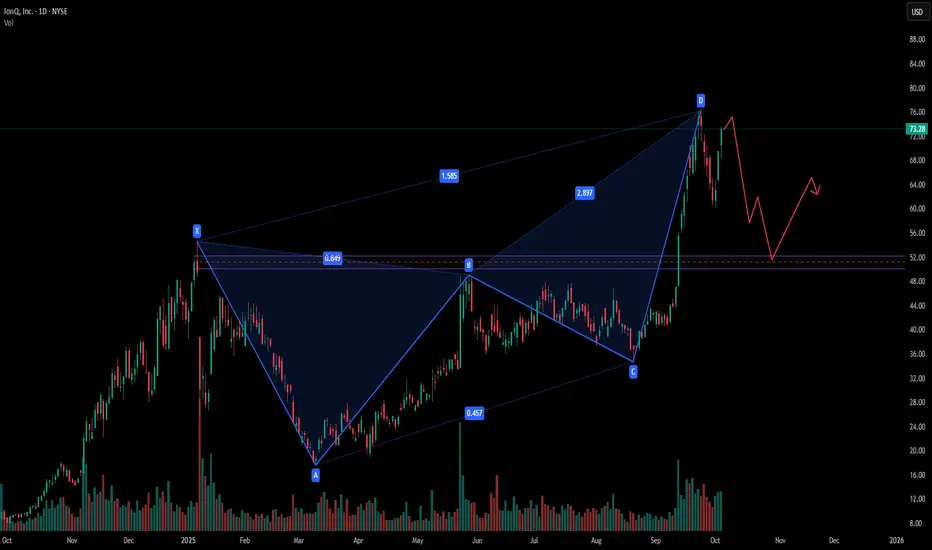
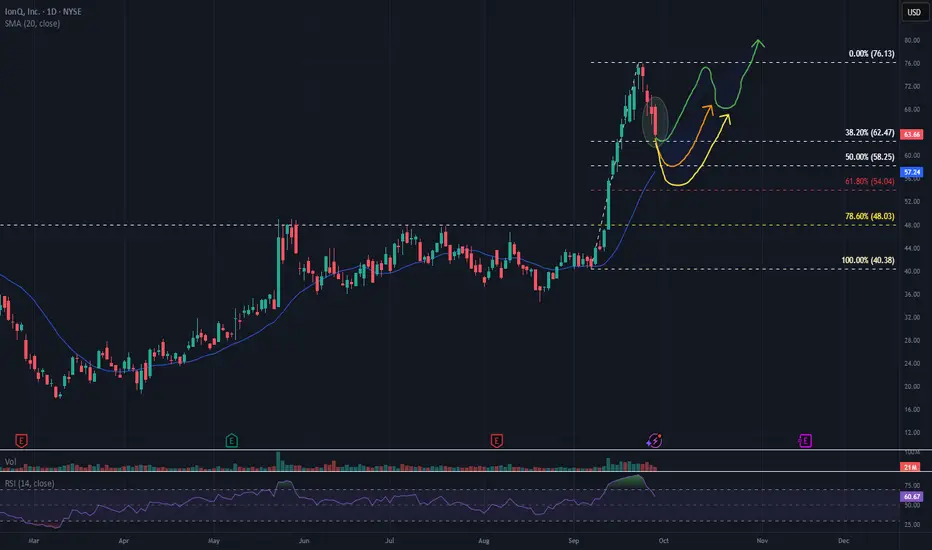
IONQ stock analysisFrom the current structure, it looks like IONQ may be forming a local top after its sharp rally. The price has completed a bearish harmonic pattern, which often signals exhaustion in bullish momentum.
If sellers step in from here, my view is that IONQ could retrace lower and head back to retest the
IONQDump this trash stock. DUMP IT.
I had this chart made weeks ago and forgot to post it. Not short, just spectating.
$IONQ - Strategic Buy Zones in IonQ (IONQ) Based on Fibonacci This chart of IonQ, Inc. (NYSE: IONQ) outlines a technical setup identifying three potential buy zones based on Fibonacci retracement levels and anticipated recovery paths:
First Buy Zone – 38.60% Retracement ~63$~~
This level may act as initial support. A bounce here could signal early recovery, e
Long trade
1Htr TF overview
📘 Trade Journal Entry
Ticker: IONQ (IonQ Inc.)
Date: Wed 8th Oct 25
Time: 3:30 pm
Session: NY Session PM
Direction: Buyside Trade
Timeframes: 1H + 15M
🔹 Trade Details
Entry: 75.40
Profit Target: 82.97 (+13.04%)
Stop Loss: 72.77 (–0.93%)
Risk-Reward Ratio (RR): 9.93
🔹 Technical

$IONQ potential for madness? +$100?If price continues to hold the $65 level as a low, then I think there's potential for an extremely large move higher from here.
I think it's possible that the stock price can go over $100 from here, which does sound crazy, but my thesis is that we're about to see a blow off top and shorts will get

$IONQ - Priced to perfection?IonQ is an early-stage quantum computing company (trapped-ion architecture). Disclosure is thin: revenue is not segmented by source and recent acquisitions (e.g. Oxford Ionics, Capella, Lightsynq) make organic revenue growth trends hard to isolate.
Even if FY2025 revenue reaches ~$100m (≈132% y/y),

IonQ Setting Up for a Key BreakoutIonQ on the Move – What’s Fueling the Surge and Key Levels to Watch 🚀
Why IonQ Has Jumped So Hard Lately
IonQ’s latest rally isn’t random—it’s powered by a string of catalysts that have caught traders’ and institutions’ attention:
* Strategic Acquisitions: The company is expanding beyond pure quantu

See all ideas
Summarizing what the indicators are suggesting.
Neutral
SellBuy
Strong sellStrong buy
Strong sellSellNeutralBuyStrong buy
Neutral
SellBuy
Strong sellStrong buy
Strong sellSellNeutralBuyStrong buy
Neutral
SellBuy
Strong sellStrong buy
Strong sellSellNeutralBuyStrong buy
An aggregate view of professional's ratings.
Neutral
SellBuy
Strong sellStrong buy
Strong sellSellNeutralBuyStrong buy
Neutral
SellBuy
Strong sellStrong buy
Strong sellSellNeutralBuyStrong buy
Neutral
SellBuy
Strong sellStrong buy
Strong sellSellNeutralBuyStrong buy
Displays a symbol's price movements over previous years to identify recurring trends.
Frequently Asked Questions
The current price of IONQ is 70.65 USD — it has decreased by −8.84% in the past 24 hours. Watch IonQ, Inc. stock price performance more closely on the chart.
Depending on the exchange, the stock ticker may vary. For instance, on NYSE exchange IonQ, Inc. stocks are traded under the ticker IONQ.
IONQ stock has risen by 0.08% compared to the previous week, the month change is a 59.44% rise, over the last year IonQ, Inc. has showed a 658.86% increase.
We've gathered analysts' opinions on IonQ, Inc. future price: according to them, IONQ price has a max estimate of 100.00 USD and a min estimate of 32.00 USD. Watch IONQ chart and read a more detailed IonQ, Inc. stock forecast: see what analysts think of IonQ, Inc. and suggest that you do with its stocks.
IONQ reached its all-time high on Oct 7, 2025 with the price of 82.97 USD, and its all-time low was 3.04 USD and was reached on Dec 28, 2022. View more price dynamics on IONQ chart.
See other stocks reaching their highest and lowest prices.
See other stocks reaching their highest and lowest prices.
IONQ stock is 9.70% volatile and has beta coefficient of 2.63. Track IonQ, Inc. stock price on the chart and check out the list of the most volatile stocks — is IonQ, Inc. there?
Today IonQ, Inc. has the market capitalization of 21.03 B, it has increased by 28.44% over the last week.
Yes, you can track IonQ, Inc. financials in yearly and quarterly reports right on TradingView.
IonQ, Inc. is going to release the next earnings report on Nov 17, 2025. Keep track of upcoming events with our Earnings Calendar.
IONQ earnings for the last quarter are −0.70 USD per share, whereas the estimation was −0.29 USD resulting in a −139.32% surprise. The estimated earnings for the next quarter are −0.44 USD per share. See more details about IonQ, Inc. earnings.
IonQ, Inc. revenue for the last quarter amounts to 20.69 M USD, despite the estimated figure of 17.23 M USD. In the next quarter, revenue is expected to reach 26.98 M USD.
IONQ net income for the last quarter is −176.84 M USD, while the quarter before that showed −32.25 M USD of net income which accounts for −448.30% change. Track more IonQ, Inc. financial stats to get the full picture.
No, IONQ doesn't pay any dividends to its shareholders. But don't worry, we've prepared a list of high-dividend stocks for you.
As of Oct 12, 2025, the company has 407 employees. See our rating of the largest employees — is IonQ, Inc. on this list?
EBITDA measures a company's operating performance, its growth signifies an improvement in the efficiency of a company. IonQ, Inc. EBITDA is −323.74 M USD, and current EBITDA margin is −492.89%. See more stats in IonQ, Inc. financial statements.
Like other stocks, IONQ shares are traded on stock exchanges, e.g. Nasdaq, Nyse, Euronext, and the easiest way to buy them is through an online stock broker. To do this, you need to open an account and follow a broker's procedures, then start trading. You can trade IonQ, Inc. stock right from TradingView charts — choose your broker and connect to your account.
Investing in stocks requires a comprehensive research: you should carefully study all the available data, e.g. company's financials, related news, and its technical analysis. So IonQ, Inc. technincal analysis shows the buy rating today, and its 1 week rating is buy. Since market conditions are prone to changes, it's worth looking a bit further into the future — according to the 1 month rating IonQ, Inc. stock shows the strong buy signal. See more of IonQ, Inc. technicals for a more comprehensive analysis.
If you're still not sure, try looking for inspiration in our curated watchlists.
If you're still not sure, try looking for inspiration in our curated watchlists.