U trade ideas

Unity Chart TrendI have been trading this trend for a long time now and this stock has not broken trend yet. If it stays course we could potentially see a move to ATH if it breaks below then we play the bearish trend.

Unity has probably bottomed and ripe to go longSupport line since july 2021 had a fake breakdown it seems. And a healthy bounce since then. Stochastics indicate we have plenty of room for a bullish move soon. Would not be surpised if we see 209$ before march 2022. If we breake down the long white support line and MA200 its time to sell it. From a fundamental perspective I think Unity has a really good position in the market and ability to capitalize on future megatrends.

$RBLX $AAPL $U $FB I OptionsSwing WatchlistRBLX 15M I RBLX is down near 20% from recent highs. $112 is acting as support. Watching for a breakout from the current downtrend on the 15 minute time frame.
AAPL 15M I AAPL showed strength the past few days as it managed to outperform its sector and QQQ. We are seeing a double bottom so far near the $160 level.
U 1H I Unity has been on a free fall and has shed 30% of its value in days. Expecting a retest of our trend on the 1 hour time frame. There is a slight div on the RSI.
FB 15M I FB has entered a bear market after falling more than 20% from ATH levels. Seems like $300 is a psychological support level that was defended last week.

Unity Software12.3.21 This is a buy zone for Unity Software. I got a little "chatty" at the send when the software stopped: BUT: don't have big stops and be aware that the first reversal higher may be a bare flag.

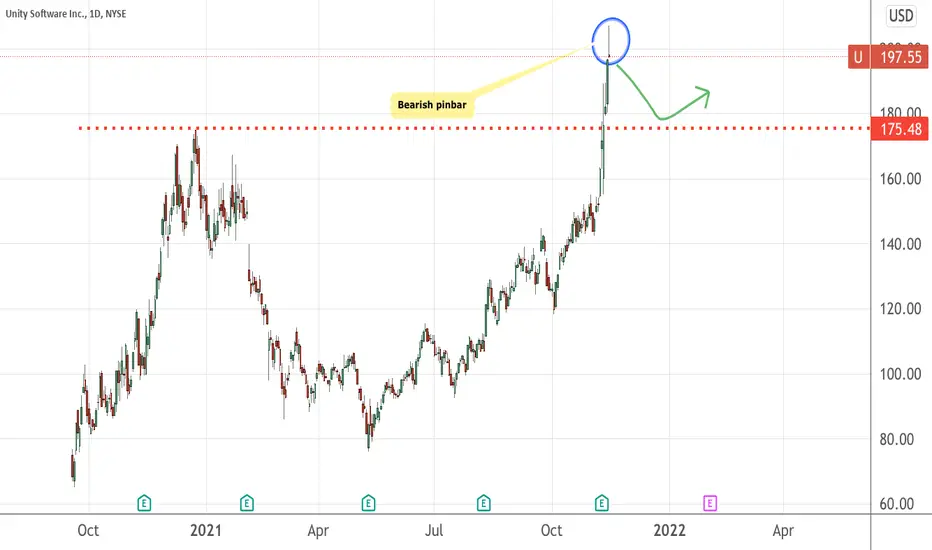
Another stock to consider in the Metaverse trendIt is pretty high to get in now , considering it has reached the resistance/peak level at 175.48 level.
The current pin bar is a sign of weakness in buying and I expect some correction ahead. If it retrace to the 175.48 level with bullish signals, I may consider nibbling.
11/28/21 UUnity Software Inc. ( NYSE:U )
Sector: Technology Services (Packaged Software)
Current Price: $179.89
Breakout price trigger: $181.00
Buy Zone (Top/Bottom Range): $179.00-$171.50
Price Target: $232.00-$236.50
Estimated Duration to Target: 68-70d
Contract of Interest: $U 2/18/22 200c
Trade price as of publish date: $14.50/contract


Unity getting ready to possibly bounceWe got a pullback to the .5 node, fufilling dow theory. We also have oscillators set up to produce hidden bullish divergence. Weekly does not show impending reversal, but a bounce could be in order.

$U shortbreak below support thats the 1st target, roll up with profits to 2nd target if continues downwards

Major pullback for UnityI'm expecting a major pullback for Unity. This thing is still way overbought and will drop a lot further over the coming months. The Metaverse is the latest fad that hypes certain technology stocks. The technology is great but we are way early on this one. This won't become a reality for a very long time, if at all. This is the 3-D Printing hype all over again. Even Zuck admits it may take several years to get there.

Unity could be looking at a pullback. With the metaverse incoming like puberty for the internet, im definitely looking to establish a position in unity. We might be seeing that time soon. Unity looks like it wants to play out some bearish divervence on the weekly chart. The rsi is pretty overbought along with forming divergrncr with tells me that a reversal could be coming soon.
There are two areas marked in red where support could be tested. So in conclusion, im short term bearish and long term ultrabullish.


U long after pullbackThe Unity Software price was continually increasing and now it is in overbought conditions (RSI>70) and above upper KC line. Therefore we expect a retracement to 50% Fib retracement level, which is also a previous resistance zone, that could act as a support for entering a long position.
Entry price: $175.08
Stop loss: $165.49
Target price: $207.33
no financial advice


Unity Software11.14.21 U Bobby's Homework Assignment . I did not think to project a target....I will try to remember this and post a chart below this video.

U - Strong break into all-time-high (ATH)Although U has recovered quite significantly from it's low of $76 in May21, it's recent break into ATH on 10 Nov is quite signifant, backed by strong volume.
I am expecting that it will have some way to rise (with near term support @ 174). Any near term retracement towards $174 would be a good opportunity to long.
ATH stocks tend to run for longer as they aren't impeded by "prior resistence", athough retracements along the way up is still part and parcel of an uptrend.
Once can consider to set profit targets along fib extension 1.618 and 2.00 of the AB swing up, or set suitable trailing stops to see how far it could go.
Disclaimer: TA is about improving our odds of a successful trade (not a guarantee). This is just my own analysis and opinion for discussion and is not a trade advice. Kindly do your own due diligence and trade

U - Potential Leader1. Confirmed Uptrend
2. Gap up & Huge Volume Post Earnings
3. Be Patient! Do not Trade right away because it is extended. Wait for a pullback to determine a proper entry.
4. Always have a SL

Long Unitybelieve the world is a better place with more creators in it. This is at the core of our business because we believe our technology can change the world. Our products give content creators the tools to not just entertain but to create innovative RT3D experiences and deliver better processes for almost every industry

Cup and HandleEarnings must have been received well. Price is OVER the top Bollinger band and is OVERBOUGHT on daily and weekly RSI set on 80, showing a lot of momentum. Price eventually returns to the safety of the bands.
An overbought stock is one that is trading at a price above its intrinsic value. When a stock is overbought, it's usually expected that the market will correct itself and move to a lower level.
The cup is 98.94 in depth so this is a deep cup. Targets are calculated using cup depth and fib levels.
Possible stop below handle low, or perhaps somewhere below where price pulled back to at market open. Everyone is different regarding risk tolerance.
Long entry level can be important to a person's psyche if a person wants to hang on for any length of time.
There is always tomorrow and the next day, well hopefully (o:
No recommendation

Unity TechnologiesA spike in consumer spending in the online gaming industry is expected to have driven Unity’s real-time 3D technology adoption among gaming companies.
Unity has been developing its platform by introducing product capabilities, which are likely to have been a major growth driver.
The constant demand for interactive, real-time 2D and 3D content for mobile phones, tablets, PCs, and virtual reality devices is likely to have aided the company’s top line.
I like the U chart. We wait for the growth to the pointed Fibonacci levels above.
Best regards,
EXCAVO

Unity Software U potential head and shoulders Lets watch out for unity this week for a potential reversal to short it. Great risk to reward ratio here.

U LongUnity Software, Inc. develops video gaming software. It provides software solutions to create, run and monetize interactive, real-time 2D and 3D content for mobile phones, tablets, PCs, consoles, and augmented and virtual reality devices.
Unity lets anyone be creative.
Unity Software Inc. (U) closed at $145.99 in the latest trading session, marking a +1.49% move from the prior day. This change outpaced the S&P 500's 0.48% gain on the day.
42.67 (41.30%) Up in the past 3 months
