UBER trade ideas
Blood Bath pattern still intact!I am still leaning toward bearishness based on recent earnings and current sentiment. This is a great name to invest in but wait for much cheaper price.
The current wave still looks like a ABC corrective wave to me. I am looking into the price movement of next few weeks to validate my bearishness.

trend lineif the market do well tomorrow, Uber could follow this trend line and bounce. It would be interesting to watch.

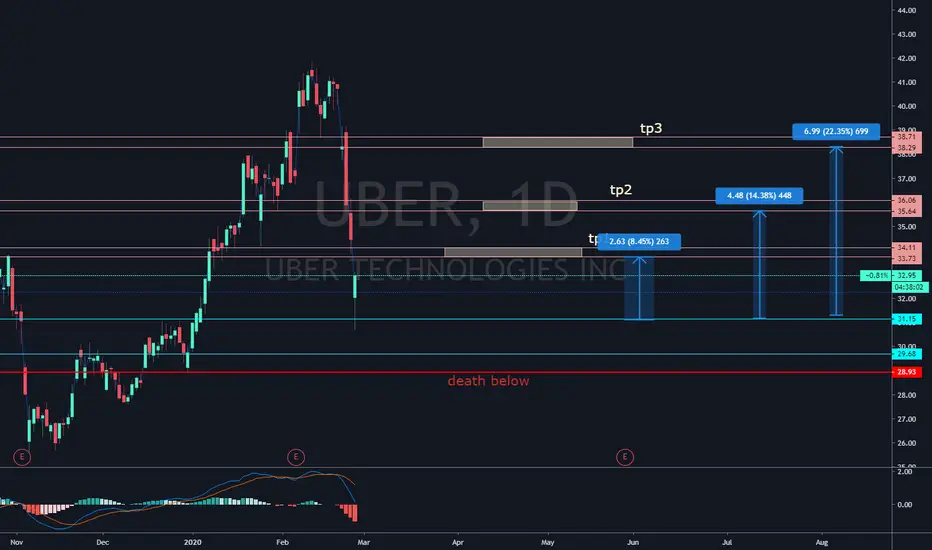
Approaching good buy territoryRSI oversold, but looks like we can bounce to the $33.60 range on the 50% fib and matchup with a retest of the uptrend line that has been in place since November 2019. If the red trend line breaks and closes below, then this trade should be aborted. Not financial advice. Happy punting! I for one will be wasting 1000's of dollars in short term call options if the test of $33.60 range happens hoping to catch the short term bounce.

UBER --- hitting the Fib Retract 618 levels now...UBER --- hitting the Fib Retract 618 levels now... interesting pulldown --- in theses cornavirus times we are in. IMO.
Good time to purchase some stock in these lows. (It go lower) never know - but Good values now. - NEW YORK Analysts Target $49.59 ▲ (29.13% Upside)
___________________________________
Disclaimer:
Always do your own due diligence, full research, and homework, and consult with your own licensed investment professional before any investments. Any comments and analysis seen here are personal opinions, and we are not registered or licensed in any jurisdiction whatsoever to provide any investing advice. Any analysis, charting and comments should never be used for the purposes of assisting in any advisory decisions with any stock purchase or sale, and never to be used on the basis of making any kind of investment decisions. It is for the sole purposes of opinions and thoughts only of the markets. Thank you.

UBER 21 EMA Break | Bearish Divergence| Corona Virus Hello Traders!
Today’s update will be on UBER, confirming a bearish divergence as the whole stock market tanks in response to recent developments on the corona virus.
Points to consider,
- Failure of higher high
- Critical 21 EMA broken
- Structural support in confluence with .50 Fibonacci
- RSI confirming bearish divergence
- Stochastics projected downwards
- Volume trading at average
UBER has put in consecutive higher lows with a recent failure of a higher high signalling weakness in the bulls. An important EMA (21), broke, a daily close below this level will increase the bearish projection.
Structural support is critical as this area is in confluence with the .50 Fibonacci, buyers are likely to step in if UBER retraces thus far.
The RSI confirmed the bearish divergence by putting in lower highs whilst the price put in higher lows. Stochastics on the other hand is projected downwards with lots of stored momentum.
Volume is trading at average, signalling that pressure from both buyers and seller is evident.
Overall, in my opinion, a confirmed close on the daily will increase bearish projection as the corona virus uncertainty takes its toll on the markets.
A retracement to structural support will be likely if the outbreak worsens
What are your thoughts?
Please leave a like and comment,
And remember,
“In order to succeed, you first have to be willing to experience failure.”
― Yvan Byeajee


UBER approached the Wolfe Wave aimAfter the huge breakout UBER price approached the aim so price may start a market correction right now. That is a good point for take profit.

UBER like it for some post earnings drift higherLike UBER long above 40ish to to 42.50 then 45.50. Best case we get a few days of consolidation then a nice break back
to all time highs.

$UBER ascending trianglePrice is clearly following the blue trend line and is nicely going back to retest resistance at $41.5 forming and ascending triangle. That happened few times before and each time price shoot up after breaking resistance. Target is above 43$ short term before a pull back to the 50 MA.

$UBER - LongFull disclosure - I am already long since $30.
Just looking at this, I still have a target minimum of $45. Not bad to play this falling wedge pattern. I would wait for the break or retest of support to confirm entry.

UBER Volitility Expansion Trade/ Mean Reversion of IV TradeWhen looking at UBER, we see that the implied volatility rank is zero, so we would like to see a mean reversion of the IV. When looking at it from a technical/price action perspective we see bullishness, but from a fundamental perspective I'm bearish. So, with that said, we don't want to guess prices yet want to capitalize on the IV expansion in UBER. The way in which we can do this is to do a long iron condor on March 13th expiration, while doing a short iron condor on the February 28th expiration. This trade provides us with a long Vega bias, while being delta neutral, and theta positive. If you want to see a full explanation, I have provided a link to a full video in trade updates below.


Uber Testing last 4 days max. number of 30 minute bars Touch1/ In last 4 trading days starting from FEB-7, majority of 30 minute BARS touched the PINK area, so that area is Tested on FEB-13 . Coincidently this pink area aligned with Camarilla S1 Pivot.
2/ FEB-12 Lyft Quarter disappointment numbers (10% down), showing above "pink area" (max. number of 30-minute bar touches) Test UBER on FEB-13


UBER trendreversal confirmed part 2Welcome fellow Tradingviewers,
Our first individual stock pick of 2020 has been outperforming our expectations. Resulting in almost 40% profit without any leverage!
In an Interview the CEO of UBER announced that UBER is going to be profitable by Q4 a whole year earlier than expected.
Besides the great news, we also had a great earnings rapport indicating upside momentum for UBER.
We will be analysing UBER using a top-down strategy, including candlestick patterns, indicators and price patterns.
Monthly:
- We can clearly see that the first month of 2020 has closed in a huge Bullish engulfing candle, indicating more upside momentum.
Weekly:
- The last weekly candle closed in a bullish engulfing candle, indicating more upside.
- The last weekly caandle managed to close above the 40 dollar resistance indicating more upside momentum.
- MACD is in bullish territory, indicating more upside momentum.
- RSI is still neutral
Daily:
- The volume has shown support of the recent price rise, with high volume buying, indicating more upside momentum.
- We are above all Ma's indicating more upside momentum.
- MACD has just crossed bullish again, indicating more upside momentum.
- RSI is showing a bearish divergence, indicating downside momentum.
In summary:
The first month has been incredible for UBER, great earnings and the road to profitability have resulted in UBER retracing almost all the way back towards the IPO price.
We are currently nearing the 43 dollar resistance, before heading towards the 46 dollar resisstance. after this the sky wouold be the limit for UBER.
So let's see how 2020 is going to unfold for UBER but for now everything is still looking healthy to start thinking about reaching a new ATH!
This analyses is only intended to share my idea, to educate and entertain you guys.
This should not be considered as financial advice.
I hope you guys enjoyed this analyses, if you did don't forget to leave a Like !
If you want to share your thoughts, please do so in the comments below!
Kind Regards,
FORALLCRYPTO
