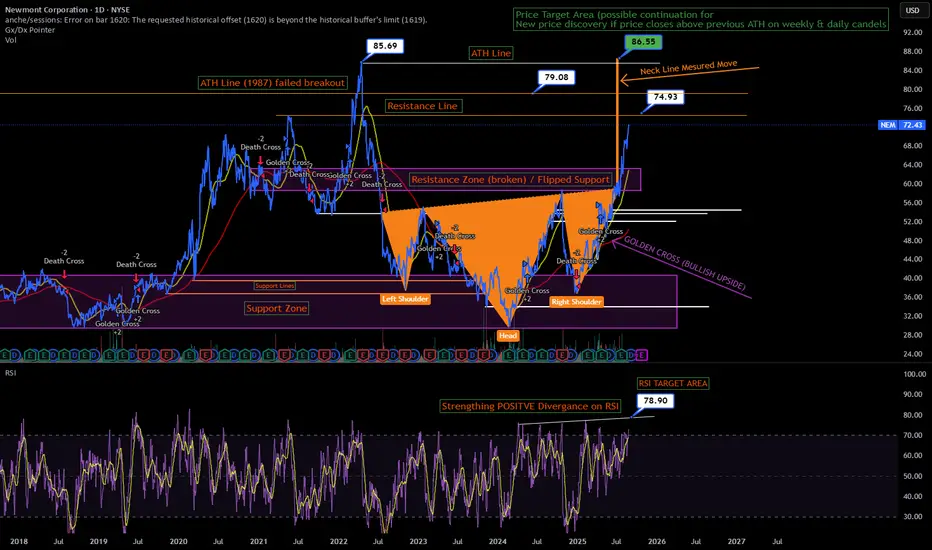
NEM Head & Shoulders technical breakout & new ATH Hi,
I actually spotted this a while ago and have keep this on the quiet but i am excited to share my first publication, This represents a clear "Ascending Inverse Head and Shoulders" with a slight favor to the upside.
I have set some price targets around potential Resistance levels also there wa
Key facts today
Next report date
—
Report period
—
EPS estimate
—
Revenue estimate
—
5.58 USD
3.28 B USD
18.56 B USD
1.10 B
About Newmont Corporation
Sector
Industry
CEO
Thomas Palmer
Website
Headquarters
Denver
Founded
1921
ISIN
US6516391066
FIGI
BBG000BPWXK1
Newmont Corp. engages in the exploration and acquisition of gold properties, containing copper, silver, lead, zinc or other metals. It operates through the following geographical segments: Canada, Mexico, Suriname, Argentina, Peru, Australia, Papua New Guinea, Ghana, and U.S. The company was founded by William Boyce Thompson on May 2, 1921 and is headquartered in Denver, CO.
Related stocks
Rally Alert: Newmont Corporation Near Key Breakout Zone
Current Price: $74.4
Direction: LONG
Targets:
- T1 = $78.50
- T2 = $83.00
Stop Levels:
- S1 = $72.00
- S2 = $70.00
**Wisdom of Professional Traders:**
This analysis synthesizes insights from thousands of professional traders and market experts, leveraging collective intelligen

NEM H&SThis looks like an inverted Head and Shoulders doesn't it?
I wouldn't be surprised if this right shoulder had a double-bottom.

Newmont Corp | NEM | Long at $48.00While gold prices have soared recently, gold mining stocks have lagged. Newmont Corp NYSE:NEM , the world's largest gold mining corporation, may be undervalued if the miners take off to catch up to the gold demand/price. Currently sitting near $48.00 and at a historical moving average that it will

NEM ASX - breakout weeklyNEM now breaking out hard.
target is $74 AUD.
gold miners have yet to move but spot price of gold has already
started accelerating higher.
Bonds yields are still negative in real terms.
equities are overvalued. BTC is in a bubble. Gold is stability.
US empire wants to initiate more Wars. Chin

Newmont showing an extremely positive outlookSome notes which can be used as arguments to the bullish outlook:
The stock is above the 200D and even the 200W EMA.
Large inverted head and shoulders structure which presents an opportunity leading up to 80$ which also turns out to be the resistance level tested in 1987 and 2022.
Locally looks

NEM - Cup and Handle - to 85Classic look. Strong despite weakening gold price. As S&P continues into new high territory, time for the laggards to pick up the pace.

Potential outside week and bullish potential for NEMEntry conditions:
(i) higher share price for ASX:NEM above the level of the potential outside week noted on 13th June (i.e.: above the level of $88.35).
Stop loss for the trade would be:
(i) below the low of the outside week on 11th June (i.e.: below $80.70), should the trade activate.

NEM Newmont Corporation engages in the production and exploration of gold properties. It also explores for copper, silver, zinc, lead, and other metals. average analyst rating $56.
Technically showing cup and handle and above all important MA's. it can run anytime now keep and eye.

Potential Uptrend in NewmontNewmont has been climbing this year, and some traders may see further upside in the S&P 500’s only pure-play gold miner.
The first pattern on today’s chart is the pullback since mid-April. The lower low, lower high and second lower low may be viewed as a potential A-B-C correction. Completion of su

See all ideas
Summarizing what the indicators are suggesting.
Neutral
SellBuy
Strong sellStrong buy
Strong sellSellNeutralBuyStrong buy
Neutral
SellBuy
Strong sellStrong buy
Strong sellSellNeutralBuyStrong buy
Neutral
SellBuy
Strong sellStrong buy
Strong sellSellNeutralBuyStrong buy
An aggregate view of professional's ratings.
Neutral
SellBuy
Strong sellStrong buy
Strong sellSellNeutralBuyStrong buy
Neutral
SellBuy
Strong sellStrong buy
Strong sellSellNeutralBuyStrong buy
Neutral
SellBuy
Strong sellStrong buy
Strong sellSellNeutralBuyStrong buy
Displays a symbol's price movements over previous years to identify recurring trends.
Curated watchlists where NEM is featured.


Frequently Asked Questions
The current price of NEM is 75.57 USD — it has increased by 1.96% in the past 24 hours. Watch Newmont Corporation stock price performance more closely on the chart.
Depending on the exchange, the stock ticker may vary. For instance, on NYSE exchange Newmont Corporation stocks are traded under the ticker NEM.
NEM stock has risen by 7.55% compared to the previous week, the month change is a 16.87% rise, over the last year Newmont Corporation has showed a 42.52% increase.
We've gathered analysts' opinions on Newmont Corporation future price: according to them, NEM price has a max estimate of 104.00 USD and a min estimate of 63.10 USD. Watch NEM chart and read a more detailed Newmont Corporation stock forecast: see what analysts think of Newmont Corporation and suggest that you do with its stocks.
NEM stock is 3.08% volatile and has beta coefficient of 0.87. Track Newmont Corporation stock price on the chart and check out the list of the most volatile stocks — is Newmont Corporation there?
Today Newmont Corporation has the market capitalization of 81.72 B, it has increased by 4.64% over the last week.
Yes, you can track Newmont Corporation financials in yearly and quarterly reports right on TradingView.
Newmont Corporation is going to release the next earnings report on Oct 23, 2025. Keep track of upcoming events with our Earnings Calendar.
NEM earnings for the last quarter are 1.43 USD per share, whereas the estimation was 1.16 USD resulting in a 23.36% surprise. The estimated earnings for the next quarter are 1.33 USD per share. See more details about Newmont Corporation earnings.
Newmont Corporation revenue for the last quarter amounts to 5.32 B USD, despite the estimated figure of 4.85 B USD. In the next quarter, revenue is expected to reach 5.08 B USD.
NEM net income for the last quarter is 2.06 B USD, while the quarter before that showed 1.89 B USD of net income which accounts for 8.99% change. Track more Newmont Corporation financial stats to get the full picture.
Yes, NEM dividends are paid quarterly. The last dividend per share was 0.25 USD. As of today, Dividend Yield (TTM)% is 1.34%. Tracking Newmont Corporation dividends might help you take more informed decisions.
As of Sep 2, 2025, the company has 42.6 K employees. See our rating of the largest employees — is Newmont Corporation on this list?
EBITDA measures a company's operating performance, its growth signifies an improvement in the efficiency of a company. Newmont Corporation EBITDA is 10.68 B USD, and current EBITDA margin is 46.62%. See more stats in Newmont Corporation financial statements.
Like other stocks, NEM shares are traded on stock exchanges, e.g. Nasdaq, Nyse, Euronext, and the easiest way to buy them is through an online stock broker. To do this, you need to open an account and follow a broker's procedures, then start trading. You can trade Newmont Corporation stock right from TradingView charts — choose your broker and connect to your account.
Investing in stocks requires a comprehensive research: you should carefully study all the available data, e.g. company's financials, related news, and its technical analysis. So Newmont Corporation technincal analysis shows the strong buy rating today, and its 1 week rating is buy. Since market conditions are prone to changes, it's worth looking a bit further into the future — according to the 1 month rating Newmont Corporation stock shows the strong buy signal. See more of Newmont Corporation technicals for a more comprehensive analysis.
If you're still not sure, try looking for inspiration in our curated watchlists.
If you're still not sure, try looking for inspiration in our curated watchlists.