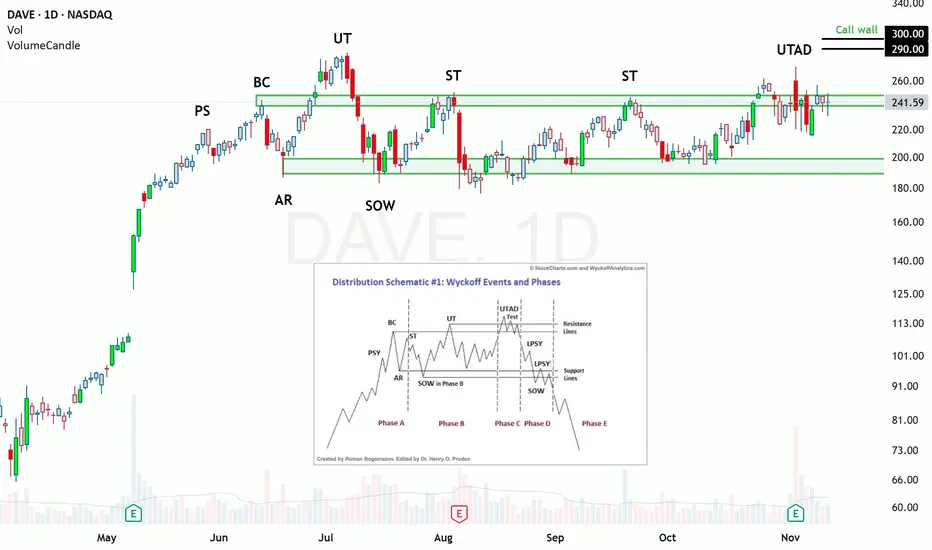
Is DAVE a Bull Trap? A Wyckoff Distribution take DAVE is flashing elements of a Wyckoff Distribution and could be setting up for a pullback soon. The market moves in cycles: buy low, uptrend, sell high, downtrend, repeat. The sell high part is what we are interested in for today's chart. Wyckoff theorized that you could identify when participants
Next report date
—
Report period
—
EPS estimate
—
Revenue estimate
—
11.03 USD
57.87 M USD
347.08 M USD
10.64 M
About Dave Inc.
Sector
Industry
CEO
Jason Wilk
Website
Headquarters
Los Angeles
Founded
2015
ISIN
US23834J2015
FIGI
BBG00Z483VQ0
Dave, Inc. is a digital banking service. Its products include a budgeting tool to help members manage their upcoming bills to avoid overspending, cash advances through its flagship ExtraCash product to help members avoid punitive overdraft fees, a Side Hustle product, where Dave helps connect members with supplemental work opportunities, and Dave Banking, a modern checking account experience with valuable tools for building long-term financial health. The company was founded by Jason Wilk, Paras Chitrakar, and John Wolanin in October 2015 and is headquartered in Los Angeles, CA.
Related stocks
New Setup on DAVEThe daily chart looks ready for an action higher at least to the previous high.
The price is going to confirm today the action above the trading range

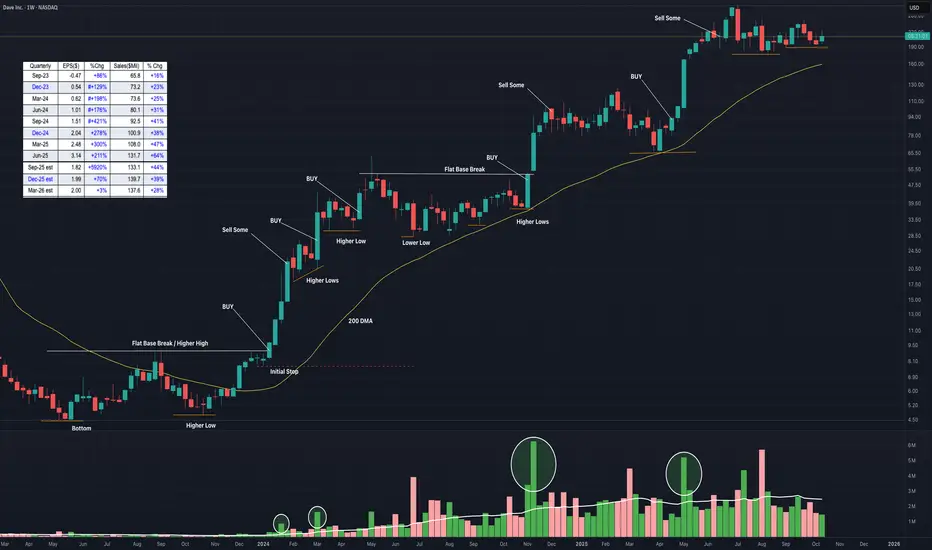
DAVE ($DAVE) — A Model CANSLIM Winner DAVE ( NASDAQ:DAVE ) — A Model CANSLIM Winner Showing Textbook Price & Volume Action
DAVE Inc. ( NASDAQ:DAVE ) has delivered one of the most impressive runs in recent memory — rising over 6,000% from its May 2023 bottom to its July 2025 high.
This weekly chart captures the full CANSLIM progression
Dave (DAVE): Strong Growth MomentumDave (DAVE): Strong Growth Momentum and Expanding Product Ecosystem Support 28% Upside — Buy Recommendation
Ticker: DAVE
Price at the time of analysis: $218.10
Upside potential: 28.4%
Target price: $280.00
Dave is a U.S. fintech company founded in 2016, focused on consumers who are underserved

Strong Momentum With balanced ReturnsIt shows a more Robust BTST setup which cleaner breakout, confirmations across technical indicators Dave Inc., is a promising candidate, BTST / INTRADAY

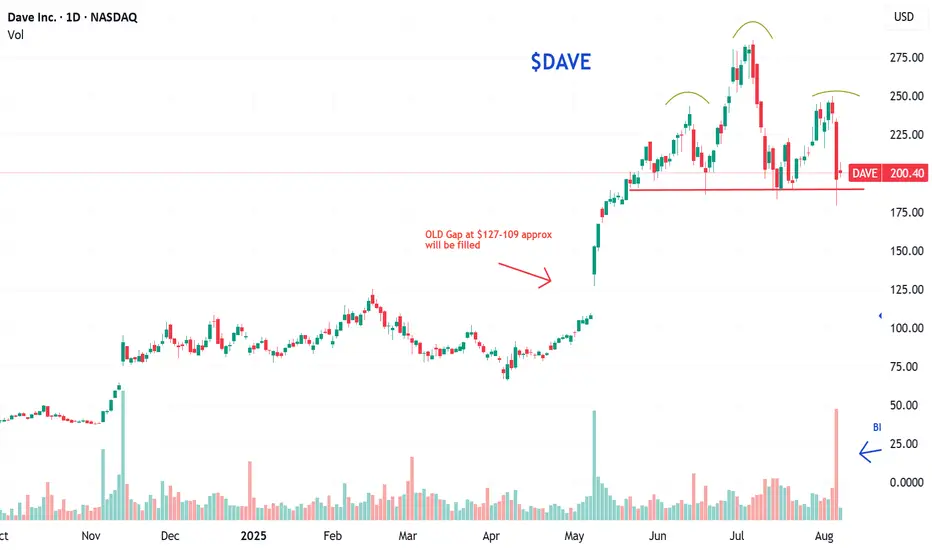
$DAVE head & shoulders formationNASDAQ:DAVE
Lousy looking head & shoulders chart pattern developing.
Look at that fund liquidation!
New Setup: DAVEDAVE has gotten oversold with a potential bullish divergence on my RSI-5. If DAVE can manage to close higher than the previous candle's high, then we can look for a bounce providing the rest of the Market is bouncing also.

Breakout in Dave Inc...Chart is self explanatory. Levels of breakout, possible up-moves (where stock may find resistances) and support (close below which, setup will be invalidated) are clearly defined.
Disclaimer: This is for demonstration and educational purpose only. This is not buying or selling recommendations. Plea

New Setup: DAVEDAVE : I have a swing trade setup signal. I'm looking to enter long if the stock can manage to CLOSE above the last candle high(BUY). If triggered, I will then place a stop-loss below (SL) and a price target above it(TP-50%,move SL to breakeven), then using the close below the 10SMA as my trailing s

Dave 24hr time frame my potterboxes Dave has broken out of one of my 24 hr potterboxes. and is riding on top. if we open green expect a new high up to possibly $47.95. If we open red expect a pullback to about 36.14 and possible bounce from this price.

See all ideas
Summarizing what the indicators are suggesting.
Neutral
SellBuy
Strong sellStrong buy
Strong sellSellNeutralBuyStrong buy
Neutral
SellBuy
Strong sellStrong buy
Strong sellSellNeutralBuyStrong buy
Neutral
SellBuy
Strong sellStrong buy
Strong sellSellNeutralBuyStrong buy
An aggregate view of professional's ratings.
Neutral
SellBuy
Strong sellStrong buy
Strong sellSellNeutralBuyStrong buy
Neutral
SellBuy
Strong sellStrong buy
Strong sellSellNeutralBuyStrong buy
Neutral
SellBuy
Strong sellStrong buy
Strong sellSellNeutralBuyStrong buy
Displays a symbol's price movements over previous years to identify recurring trends.
Frequently Asked Questions
The current price of DAVE is 182.51 USD — it has decreased by −4.00% in the past 24 hours. Watch Dave Inc. stock price performance more closely on the chart.
Depending on the exchange, the stock ticker may vary. For instance, on NASDAQ exchange Dave Inc. stocks are traded under the ticker DAVE.
DAVE stock has fallen by −24.84% compared to the previous week, the month change is a −14.70% fall, over the last year Dave Inc. has showed a 119.89% increase.
We've gathered analysts' opinions on Dave Inc. future price: according to them, DAVE price has a max estimate of 347.00 USD and a min estimate of 274.00 USD. Watch DAVE chart and read a more detailed Dave Inc. stock forecast: see what analysts think of Dave Inc. and suggest that you do with its stocks.
DAVE reached its all-time high on Feb 2, 2022 with the price of 491.07 USD, and its all-time low was 4.47 USD and was reached on May 10, 2023. View more price dynamics on DAVE chart.
See other stocks reaching their highest and lowest prices.
See other stocks reaching their highest and lowest prices.
DAVE stock is 9.75% volatile and has beta coefficient of 3.11. Track Dave Inc. stock price on the chart and check out the list of the most volatile stocks — is Dave Inc. there?
Today Dave Inc. has the market capitalization of 2.57 B, it has decreased by −8.16% over the last week.
Yes, you can track Dave Inc. financials in yearly and quarterly reports right on TradingView.
Dave Inc. is going to release the next earnings report on Mar 9, 2026. Keep track of upcoming events with our Earnings Calendar.
DAVE earnings for the last quarter are 6.34 USD per share, whereas the estimation was 1.82 USD resulting in a 248.35% surprise. The estimated earnings for the next quarter are 2.95 USD per share. See more details about Dave Inc. earnings.
Dave Inc. revenue for the last quarter amounts to 150.80 M USD, despite the estimated figure of 133.06 M USD. In the next quarter, revenue is expected to reach 155.26 M USD.
DAVE net income for the last quarter is 92.07 M USD, while the quarter before that showed 9.04 M USD of net income which accounts for 918.50% change. Track more Dave Inc. financial stats to get the full picture.
No, DAVE doesn't pay any dividends to its shareholders. But don't worry, we've prepared a list of high-dividend stocks for you.
As of Nov 21, 2025, the company has 274 employees. See our rating of the largest employees — is Dave Inc. on this list?
EBITDA measures a company's operating performance, its growth signifies an improvement in the efficiency of a company. Dave Inc. EBITDA is 150.47 M USD, and current EBITDA margin is 12.19%. See more stats in Dave Inc. financial statements.
Like other stocks, DAVE shares are traded on stock exchanges, e.g. Nasdaq, Nyse, Euronext, and the easiest way to buy them is through an online stock broker. To do this, you need to open an account and follow a broker's procedures, then start trading. You can trade Dave Inc. stock right from TradingView charts — choose your broker and connect to your account.
Investing in stocks requires a comprehensive research: you should carefully study all the available data, e.g. company's financials, related news, and its technical analysis. So Dave Inc. technincal analysis shows the sell today, and its 1 week rating is sell. Since market conditions are prone to changes, it's worth looking a bit further into the future — according to the 1 month rating Dave Inc. stock shows the buy signal. See more of Dave Inc. technicals for a more comprehensive analysis.
If you're still not sure, try looking for inspiration in our curated watchlists.
If you're still not sure, try looking for inspiration in our curated watchlists.