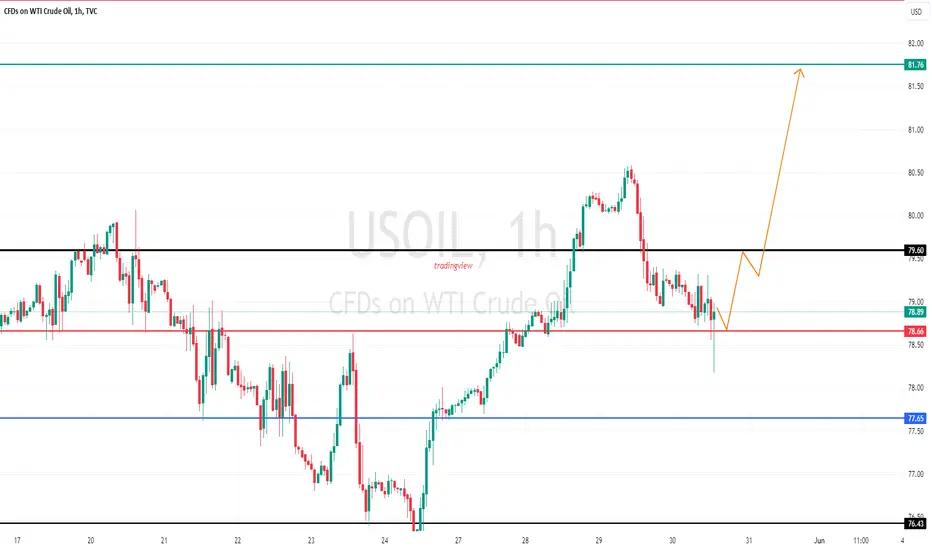
USOIL - Inverted Head & Shoulders: Formation of 2nd shoulderUSOIL is ready to make its 2nd shoulder, if it succeeds then you guys can grab a handsome profit from this trade. Check my chart to get more idea about Long position holding.
OIL_CRUDE trade ideas

Crude Oil Back at Pivotal SupportWTI is back at a major support pivot we've been tracking for months now at 77.56/67 .
A weekly close below this threshold would be needed to invalidate the yearly uptrend and exposes a possible plunge towards 75.33 and the yearly Low-day close at 72.93 .
Key resistance steady at the 200-day moving average / 38.2% retracement at 79.89-80.01 .
Moment of truth for the bulls - watch the weekly close here. .
Michael Boutros
@MBForex

WTI OIL Strong rejection on 1D MA200 but be aware of a break-outWTI Oil (USOIL) made yesterday a strong rejection on the 1D MA200 (orange trend-line), which has been essentially the Resistance since the price broke below it on May 01. Having this level as a Resistance for 3 weeks makes it the strongest sell entry candidate, considering also the fact that this is the top of the 1-month Channel Down, thus a new Lower High.
As long as we don't close a 1D candle below the 1D MA200, we will be bearish, targeting 74.00 (-7.75% decline, similar to both previous Bearish Legs of the Channel Down). If we do close a 1D candle above the 1D MA200, we will take the small loss and target 83.00 (the 2.0 Fibonacci extension). The reason for being prepared for a long position as well, is because the 1D MACD formed a Bullish Cross.
-------------------------------------------------------------------------------
** Please LIKE 👍, FOLLOW ✅, SHARE 🙌 and COMMENT ✍ if you enjoy this idea! Also share your ideas and charts in the comments section below! This is best way to keep it relevant, support us, keep the content here free and allow the idea to reach as many people as possible. **
-------------------------------------------------------------------------------
💸💸💸💸💸💸
👇 👇 👇 👇 👇 👇

USOIL PRICE BULLISH SENTIMENT WITH HOPEFUL SIGNS📈USOIL Anylisis
🔍Currently USOIL Finds itself at a crossroads caught between two vitel daily structures. Looking ahead to potential moves here are two scen to watch:
1) Bullish outlook if the market breaks the trend line and seals the deal with a solid close above a hefty resistance line forming a Substantial falling wedge on the dialy chart it might be time to gear up for a bullish ride. Traders could set their sights on a target of at least 78.8500
2) Bearish perspective: on the flip side a Breach of the crucial 76.700 support level could spell trouble for the bulls. This move would signify strong bearish confirmation possibly paving the way for a significant download plunge with a downsides Target of around 79.9500
In essence the fate of USOIL hangs in the balance with traders eagerly awaiting signals of either bullish resurgence 🚀 or Bearish dominace in a head stay tuned for Updates! 📈

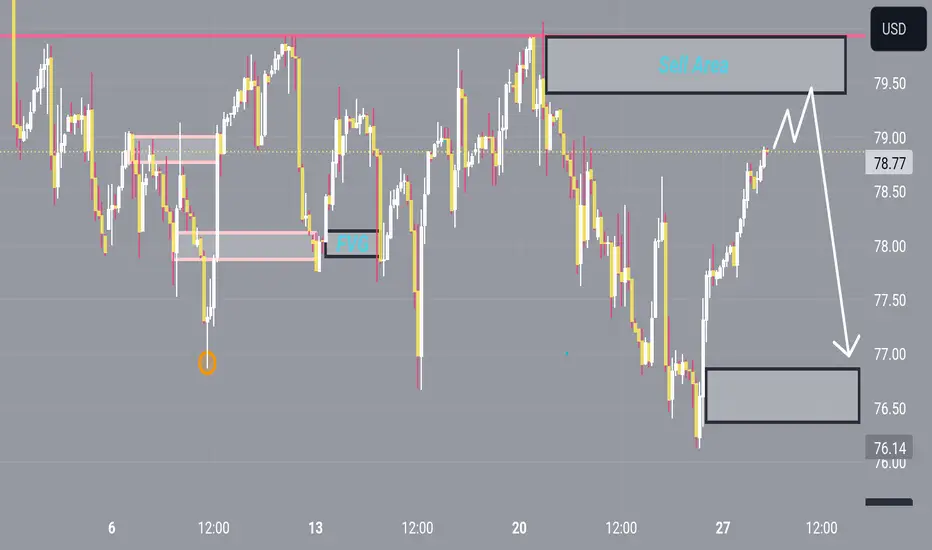
Don't miss this analysis, it will help you!Looking at the icon currently seeing bullish price action on the 15 meter time frame, a pullback/pullback on the 4 hour time frame, and now showing bearish price action.
This appears to be a preparation for a lower time frame to realign higher time frame price behavior. The price is expected to "enter" the price point of 78.36, where there is a definite flow of bearish orders.
The price is currently at a premium, so we are only interested in shorts at this time. We are also using internal interval liquidity (fvg, fixed liquidity) below the current support level as a confluence point for prices to move lower in the coming hours.
Happy trade

The pros' next week analysis and strategy for crude oilMarket Analysis: Crude Oil Price Signal Bearish Acceleration
Crude oil prices declined steadily below the $80.00 support and moved into a bearish zone.
Important Takeaways for Oil Prices Analysis Today
Crude oil prices extended downsides below the $78.00 support zone.
A major bearish trend line is forming with resistance near $78.00 on the hourly chart of XTI/USD at FXOpen.
Oil Price Technical Analysis
On the hourly chart of WTI Crude Oil at FXOpen, the price struggled to continue higher above $80.00 against the US Dollar. The price formed a short-term top and started a fresh decline below $78.00.
There was a steady decline below the $77.40 pivot level. The bears even pushed the price below $76.50 and the 50-hour simple moving average. Finally, the price tested the $76.30 zone. The recent swing low was formed near $76.31, and the price is now consolidating losses.
Immediate support is near the $76.30 level. The next major support on the WTI crude oil chart is near $75.00. If there is a downside break, the price might decline toward $73.50. Any more losses may perhaps open the doors for a move toward the $72.00 support zone.
On the upside, immediate resistance is near the 23.6% Fib retracement level of the downward move from the $78.52 swing high to the $76.31 low at $76.80.
The next resistance is near the 50-hour simple moving average and the 50% Fib retracement level of the downward move from the $78.52 swing high to the $76.31 low at $77.40. The main resistance is near a trend line at $78.00.
A clear move above the trend line resistance could send the price toward $79.05. The next key resistance is near $79.90. If the price climbs further higher, it could face resistance near $81.20. Any more gains might send the price toward the $82.00 level.

Good analysis and strategy, please read it carefullyHello, trader.
Summary
Entry = 79.406
Target 1= 82.283
Target 2 = 85.000
Risk: Reward= 2.33
Follow and Boost and my ideas!!!
Let's grow together.
Happy trade

USOIL - where is current support? holding or not??#USDOIL.. market placed 80 plus day high and dropped again . now market have a supporting area here,
keep close it because if market hold it then again bounce expected from here,
don't be lazy here.
good luck
trade wisely
Crude Oil: Long Position Amidst Support and SeasonalityWe are considering a long position on crude oil, given that the price has reached a significant support area. This support level is reinforced by a divergence observed on the Relative Strength Index (RSI), suggesting a potential reversal in the current trend. Additionally, seasonality data supports the likelihood of a bullish movement during this period.
The convergence of these technical indicators and historical trends strengthens our conviction for a long setup. The RSI divergence indicates that the recent downward momentum may be waning, while the support area provides a strong foundation for a potential price rebound. Furthermore, seasonality data, which highlights recurring patterns in price behavior during specific times of the year, suggests that crude oil prices are poised for an upward movement.
In light of these factors, we are looking to establish a long position on crude oil, capitalizing on the technical setup and historical data that align to suggest a favorable entry point for a bullish trade.

Crude Oil (WTI) may rise to 80.90 - 81.35Pivot
79.35
Our preference
Long positions above 79.35 with targets at 80.90 & 81.35 in extension.
Alternative scenario
Below 79.35 look for further downside with 78.95 & 78.50 as targets.
Comment
The RSI advocates for further upside.
Supports and resistances
81.90
81.35
80.90
80.23 Last
79.35
78.95
78.50
Number of asterisks represents the strength of support and resistance levels.

USOIL sell side Hey there on 2hTF the USOIL has looking today sell scenario can be retest from 79.00
79.50 can there again slip downside continue will looks for next support 77.50
Crude oil prices resumed their rise,Yesterday said that as long as yesterday's rising market did not break the starting point of the main fall of 3 waves 83.63 US dollars, it can be regarded as 4 waves rebound, currently is not broken 83.63 US dollars, but broke 80.11 US dollars, that is, broke the starting point of 5 waves of our previous number of waves, but now it can also be looked at as the abc three waves after the main fall of 5 waves. That is, the rise of the market from $76.15 to $80.62 is a wave, and the current pullback is a wave b, then the wave b will be back to $78.20-78.50 this range and then rise to $80.63 in order to walk out of a complete wave c, as long as it does not break $83.63 we can look at 4 waves rising. Breaking $83.63 is abc three waves after five waves, not breaking $83.63 is three sub-waves of four waves.
1, below $78.25 long, stop a loss of 30 points, stop a profit of about $80.25 (more aggressive can be long at $78.70).
2, short above $80.55, stop loss 35 points, stop profit of $78.50.
3, if the strategy 2 short is stopped, go short again at $81.70, stop a loss of 30 points, and stop a profit of $79.70.

WTI TO GO BULLISH!Price may go bullish if we can get a price offer at 78.450. Following the upcoming U.S. pce news coming up, price surged higher today & made 0.25% increase. A buy opportunity is envisaged when price drops to 78.450
Target is 79.00

Crude Oil (WTI) may rise to 78.30 - 78.70Pivot
77.50
Our preference
Long positions above 77.50 with targets at 78.30 & 78.70 in extension.
Alternative scenario
Below 77.50 look for further downside with 77.15 & 76.60 as targets.
Comment
The RSI is bullish and calls for further advance.
Supports and resistances
79.00
78.70
78.30
78.02 Last
77.50
77.15
76.60
Number of asterisks represents the strength of support and resistance levels.

USOIL: Oil prices have turned downUSOIL: Oil fees have became down. In the fast time period, there are symptoms and symptoms of breaking the preceding growing channel. Besides, the fast-time period accumulation region around $77 -seventy nine is likewise displaying a main weak point withinside the context that OPEC+ has finished its discount goal and is making plans to boom production. In the fast-time period destiny scenario, it's far in all likelihood that OIL will drop to deeper charge levels. You can watch to promote with short-time period expectancies of around $75/1 barrel.

XAUAUDThe Chart is printing HH and HL with no divergence so the trend is Bullish
The Entry Point will be 80.66 and the stop Loss will be 78.84

Can Oil soar on June 2 OPEC+ cut hopes? Can Oil soar on June 2 OPEC+ cut hopes?
WTI crude futures and Brent continue to recover from three-month lows. The rebound is potentially driven by expectations that OPEC+ will extend its output cuts of 2.2 million barrels per day into the second half of the year during its June 2 meeting.
Additional support for crude prices came from the start of the U.S. summer driving season and a weaker dollar.
Further data on the demand side will come from upcoming U.S. PCE to gauge the Federal Reserve's future monetary policy. A softer-than-expected reading on the PCE could increase the possibility of interest rate cuts, and potentially enhance the demand for energy.
Deutsche Bank has maintained its Brent forecast at $83 per barrel for the second quarter and $88 for the second half of the year, assuming OPEC+ will sustain its current production policy on Sunday.
Should prices move above the $80 level, WTI could test the 50-day moving average just above $81.1. The RSI suggests there is still room for prices to rise before reaching the overbought zone. Conversely, if prices fall below the $78 range, they might stabilize around the $76 mark.

Oil long soonI love this Oil long chance here, Aiming for 87-90 area or anywhere in the rectangle. Conservative traders can wait for a break of the channel to get long. I will do the same.

Oil BoilAll ideas are strictly my interpretation of price action. I am not a professional trader nor is this
professional advice.
I will continually update all trades.


WTI (Crude) Price Action on 15m TimeframeThere is currently seeing bullish price action on the 15m timeframe which appears to be a pullback/retracement on the 4h timeframe which is now displaying bearish price action.
This appears to be preparation of lower timeframe re-alignment of the higher timeframe price action. The expectation is that price will "tap-in" at the 78.36 price point where there is identified bearish orderflow.
Price is currently in Premium so we are only interested in shorts at this time. We also are using internal range liquidity (FVGs, Trandline Liquidity) below the current support as confluence for downward price movement in the coming hours.

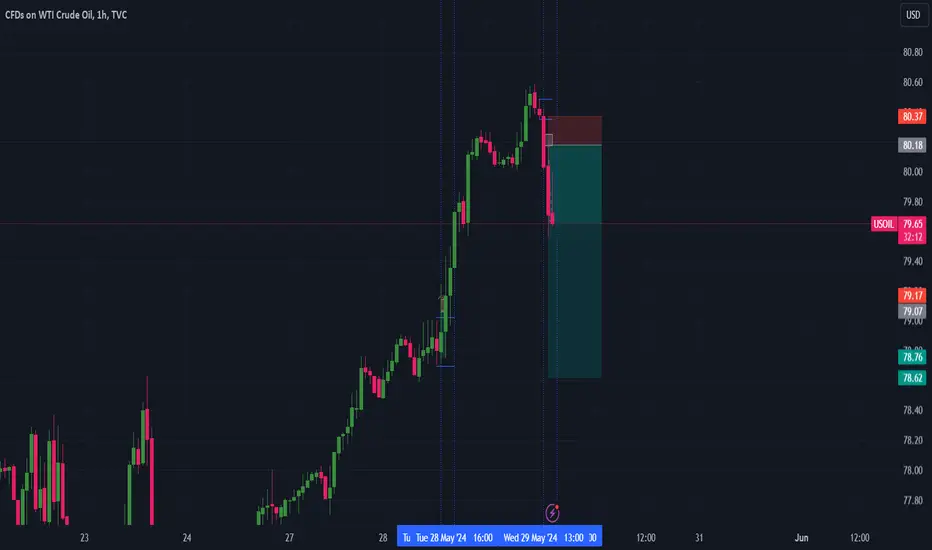
USOIL Will Go Lower From Resistance! Sell!
Here is our detailed technical review for USOIL.
Time Frame: 9h
Current Trend: Bearish
Sentiment: Overbought (based on 7-period RSI)
Forecast: Bearish
The market is on a crucial zone of supply 79.46.
The above-mentioned technicals clearly indicate the dominance of sellers on the market. I recommend shorting the instrument, aiming at 77.06 level.
P.S
Please, note that an oversold/overbought condition can last for a long time, and therefore being oversold/overbought doesn't mean a price rally will come soon, or at all.
Like and subscribe and comment my ideas if you enjoy them!
