WTI ShortWTI
Short
Price rose aggressively with no retracement. it ran into 4H/1H formerly bearish signal, long tailed.
Will be aggressive profit taking 1to1 and then a runner trade all the way to former consolidation @ 76-ish
OIL_CRUDE trade ideas

USOIL ANALYSIS (SHORT) (11/06/24)Pretty self explanatory and simple. Using the bias (Bearish) I simply mapped out the last area which created a significant break. Within this area - price should gear towards the demand zone below - however I do acknowledge that price had already reached demand in an earlier period and therefore if price breaks through the POI (For which there will be potential to do so - due to upper imbalance found on a bigger TF), I would seek for an entry point allowing me to ride out the buy.

USOIL BUY Usoil buy side analysis got 170 pips profit running TP near to hit
Perfect time entered 1:3RR
Overall trend still sell side

USOIL printing bullish ascending channelUSOIL printing bullish ascending channel,
Buy on FIB .5 as buy limit

WTI Will Fill Its Intraday GapFor these reasons, we are bullish on WTI:
- large, open intraday gap. These gaps never stay open for long
- Signs of stabilization or a correction attempt


US OilDetailed Analysis of WTI Crude Oil (1h Chart)
Indicators Used:
• Moving Averages (MAs)
• Bollinger Bands
• Commodity Channel Index (CCI)
• Moving Average Convergence Divergence (MACD)
• Stochastic Oscillator
• Support and Resistance Levels
Technical Analysis:
1. Moving Averages:
• Short-term (Red) and Long-term (Green) MAs: The short-term moving average is below the long-term moving average, indicating a bearish trend. The price is also trading below the 200-period MA, which typically suggests a longer-term bearish sentiment.
• Price Action: The price is currently below the 200-period MA and just around the 50-period MA, showing some signs of consolidation or potential short-term reversal.
2. Bollinger Bands:
• Band Width: The bands are relatively wide, indicating increased volatility.
• Price Position: The price is moving near the middle band, suggesting a potential equilibrium. The recent touches to the lower band indicate the price might have been oversold in the short term.
3. CCI (Commodity Channel Index):
• Current Reading: The CCI is around the -100 level, which often indicates that the market is oversold, but it’s moving towards the middle line, indicating some recovery.
4. MACD:
• Histogram and Signal Line: The MACD histogram is below the zero line, with the MACD line close to crossing above the signal line. This could indicate a potential bullish crossover, signaling a possible upward momentum.
• Momentum: The bearish momentum seems to be weakening as indicated by the histogram moving towards zero.
5. Stochastic Oscillator:
• %K and %D Lines: The Stochastic lines are in the middle range, suggesting a period of consolidation. The lines have crossed upwards, which might indicate a potential short-term bullish move.
• Crossovers: Watch for further bullish crossovers as confirmation of a potential upward move.
6. Support and Resistance Levels:
• Immediate Resistance: Around 76.50, which is a recent resistance level formed by previous highs.
• Immediate Support: Around 75.00, which has been a support level in the recent past.
• Strong Support: Around 73.50, a more significant support level if the current one fails.
Best Trade Opportunity:
Trade Setup:
• Entry Point: Consider entering a long position if the price breaks and holds above the immediate resistance of 76.50 with confirmation from the MACD and Stochastic Oscillator.
• Confirmation: Look for a bullish crossover in the Stochastic Oscillator and the MACD histogram moving into positive territory.
• Stop Loss: Set a stop loss below the immediate support level at 75.00 to minimize potential losses.
• Target: Aim for a target around the next significant resistance level at 78.00 to 79.00.
Alternative Short Trade Setup:
• Entry Point: Consider entering a short position if the price breaks below the immediate support of 75.00 with strong bearish confirmation from the MACD and CCI.
• Confirmation: Look for further downside momentum in the MACD and CCI staying in the oversold region.
• Stop Loss: Set a stop loss above the immediate resistance level at 76.50.
• Target: Aim for a target around the strong support level at 73.50.
Confidence in the Trade:
Confidence Factors:
• Technical Confirmation: Multiple indicators are suggesting oversold conditions, which could point to a potential bullish reversal.
• Support and Resistance: Clearly defined support and resistance levels provide a structured framework for trade planning.
• Volatility: Increased volatility indicated by the Bollinger Bands could suggest significant price movement, enhancing the risk/reward profile.
Factors to Monitor:
• Market News: Keep an eye on any significant economic news or events that might affect crude oil prices, such as inventory reports or geopolitical developments.
• Volume: Watch for increasing volume on the breakout for added confirmation of the trade direction.
Summary:
• Primary Trade: Long position above 76.50 with a target of 78.00 to 79.00.
• Alternative Trade: Short position below 75.00 with a target of 73.50.
• Confidence Level: Moderate to High, given the technical setup and clear levels of support and resistance.
By monitoring these indicators and adhering to the outlined trade setups, you can navigate the WTI Crude Oil market with a structured approach and manage potential risks effectively.

USOIL, D1This week seem like usoil price will make a retracement. Overall still looking for a downtrend as price has broken previous low.

Nice weekly candles here on OilOverall pattern on higher time frames paints a clear bullish oil picture. Nice simple risk here with stops at the bottom of the weekly.

USOIL Trading IdeaBased on Simple Technical Analysis ( Trendline + Support & Resistance )
Risk Disclaimer:
Please be advised that I am not telling anyone how to spend or invest their money. Take all of my analysis as my own opinion, as entertainment, and at your own risk. I assume no responsibility or liability for any errors or omissions in the content of this page, and they are for educational purposes only. Any action you take on the information in these analysis is strictly at your own risk. There is a very high degree of risk involved in trading. Past results are not indicative of future returns. Good luck :-)

USOIL PULLBACK BEFORE ANOTHER DIP#USOIL As predicted last time, we observed a significant drop following the breakout identified in the bullish channel. Currently, we see consolidation, a bearish impulse, and now a pullback. We anticipate another downward movement once the current bullish impulse concludes. This is expected to retest the recent lows near the major demand zone previously highlighted.

US OilOverview
The chart for WTI Crude Oil on the 1-hour timeframe shows significant movements, with the price interacting with key Fibonacci levels, support, and resistance zones. The indicators used include Moving Averages, Bollinger Bands, Commodity Channel Index (CCI), MACD, Stochastic Oscillator, and Support and Resistance levels.
Key Observations
1. Moving Averages (200 MA and 50 MA):
• 200 MA (Green Line): The price is currently around the 200 MA, suggesting a critical point for determining the long-term trend direction.
• 50 MA (Red Line): The price is interacting with the 50 MA, indicating short-term trend considerations.
2. Bollinger Bands:
• The price is near the middle Bollinger Band, indicating that the market might be at an equilibrium point. The previous move from the lower band suggests the market might be consolidating.
3. Commodity Channel Index (CCI):
• The CCI is likely around 0, indicating neutral conditions. This suggests neither overbought nor oversold conditions.
4. MACD (Moving Average Convergence Divergence):
• The MACD line is above the signal line, and the histogram is showing positive values, indicating bullish momentum. However, the histogram shows signs of decreasing momentum.
5. Stochastic Oscillator:
• The Stochastic Oscillator is below 20, indicating oversold conditions. This suggests that a rebound may be imminent.
6. Fibonacci Retracement Levels:
• Key Fibonacci levels are plotted from the recent low at 72.52 to the recent high at 76.18.
• 0.236 (75.32), 0.382 (74.78), 0.5 (74.35), 0.618 (73.92), 0.786 (73.31)
• The price is currently around the 0.236 Fibonacci level (75.32), indicating potential support.
7. Support and Resistance Levels:
• Resistance Zones: Significant resistance is seen around 76.18, 78.50, and above.
• Support Zones: The recent low at 72.52 and significant Fibonacci levels act as support.
Comprehensive Technical Analysis
1. Current Trend:
• The long-term trend is ambiguous as the price is interacting with the 200 MA. The short-term trend shows potential bullish momentum, as indicated by the price movement relative to the 50 MA.
2. Equilibrium Conditions:
• The price being near the middle Bollinger Band suggests equilibrium, with potential for a move towards either the upper or lower band.
3. Volume:
• Volume analysis can indicate the strength of the price movement. The current volume shows relatively stable activity, suggesting consolidation.
4. Key Support and Resistance Levels:
• Resistance: Significant resistance levels are at 76.18, 78.50, and above.
• Support: The recent low at 72.52 and Fibonacci levels (75.32, 74.78, 74.35, 73.92, 73.31) act as support.
5. Momentum Analysis:
• The MACD indicates bullish momentum, but decreasing histogram bars suggest potential weakening.
• The Stochastic Oscillator indicates oversold conditions, suggesting a potential rebound.
Best Trade Opportunity
Given the current market conditions, the best trade opportunity appears to be a short-term buy trade to take advantage of the oversold conditions and potential for a rebound.
Trade Setup:
• Buy Level: Around 75.35 (current level near the 0.236 Fibonacci level)
• Stop Loss: Below 74.78 (to account for potential further downside, just below the 0.382 Fibonacci level)
• Take Profit:
• First target: 76.18 (recent high)
• Second target: 78.50 (significant resistance level)
Trade Rationale:
• Oversold Indicators: The Stochastic Oscillator below 20 suggests that the market is oversold and due for a potential rebound.
• Fibonacci Support: The price around the 0.236 Fibonacci level indicates potential support.
• Risk-Reward Ratio: Entering a buy position near 75.35 offers a favorable risk-reward ratio, especially with a tight stop loss below the 0.382 Fibonacci level.
• Volume Consideration: Stable volume suggests consolidation, which might lead to a breakout.
Summary
• Buy Opportunity: Enter at 75.35 with a stop loss below 74.78.
• Targets: 76.18 (first target) and 78.50 (second target).
• Rationale: The market shows potential for a rebound given the oversold conditions indicated by the Stochastic Oscillator and support around the Fibonacci levels.

Oil 15 min. Trade StrategyTrend based strategy on 15 min. Oil. Based on Swing Trading principles with harmonics. Also includes some specific chart pattern trades.

Oil June 7 2024 - my_MATR1 hour Oil chart to June 7th 2024 using my_MATR, which is a trend shift indicator with some cookies added to it, like Bull / Bear market signals and exhaustion alarm.

HOW TO FIND ENTRY ON CRUDE OIL A pullback back into the 50 Fibonacci area am looking forward to go short with first and second target at $72-65

WHY CRUDE OIL MIGHT CRASH TO $40/BARREL BEFORE 2025Daily timeframe trend line breakout. Forward down side expected in coming weeks

USOIL Is Going Down! Sell!
Take a look at our analysis for USOIL.
Time Frame: 2h
Current Trend: Bearish
Sentiment: Overbought (based on 7-period RSI)
Forecast: Bearish
The market is approaching a key horizontal level 75.96.
Considering the today's price action, probabilities will be high to see a movement to 74.80.
P.S
The term oversold refers to a condition where an asset has traded lower in price and has the potential for a price bounce.
Overbought refers to market scenarios where the instrument is traded considerably higher than its fair value. Overvaluation is caused by market sentiments when there is positive news.
Like and subscribe and comment my ideas if you enjoy them!

USOIL SENDS CLEAR BEARISH SIGNALS|SHORT
Hello,Friends!
It makes sense for us to go short on USOIL right now from the resistance line above with the target of 73.84 because of the confluence of the two strong factors which are the general downtrend on the previous 1W candle and the overbought situation on the lower TF determined by it’s proximity to the upper BB band.
✅LIKE AND COMMENT MY IDEAS✅

Trade Like A Sniper - Episode 24 - USOIL - (7th June 2024)This video is part of a video series where I backtest a specific asset using the TradingView Replay function, and perform a top-down analysis using ICT's Concepts in order to frame ONE high-probability setup. I choose a random point of time to replay, and begin to work my way down the timeframes. Trading like a sniper is not about entries with no drawdown. It is about careful planning, discipline, and taking your shot at the right time in the best of conditions.
A couple of things to note:
- I cannot see news events.
- I cannot change timeframes without affecting my bias due to higher-timeframe candles revealing its entire range.
- I cannot go to a very low timeframe due to the limit in amount of replayed candlesticks
In this session I will be analyzing USOIL, starting from the 6-Month chart.
If you want to learn more, check out my other videos on TradingView or on YT.
If you are interested in private coaching, feel free to get in touch via one of my socials.

Possible Retest for WTI Crude Oil.WTI Crude Oil has been in a consolidation Phase since the beginning of the month. After breaking out of it recently, I expect the price to go up the decision Point Zone and to then drop.
Lets see if this trade works out.
TVC:USOIL

CRUDE OIL Will Fall! Sell!
Hello,Traders!
CRUDE OIL is going up
Now and it looks like
It is set to retest
The horizontal resistance
Of 76.86$ from where
We will be expecting
A pullback and a
Move down
Sell!
Like, comment and subscribe to help us grow!
Check out other forecasts below too!

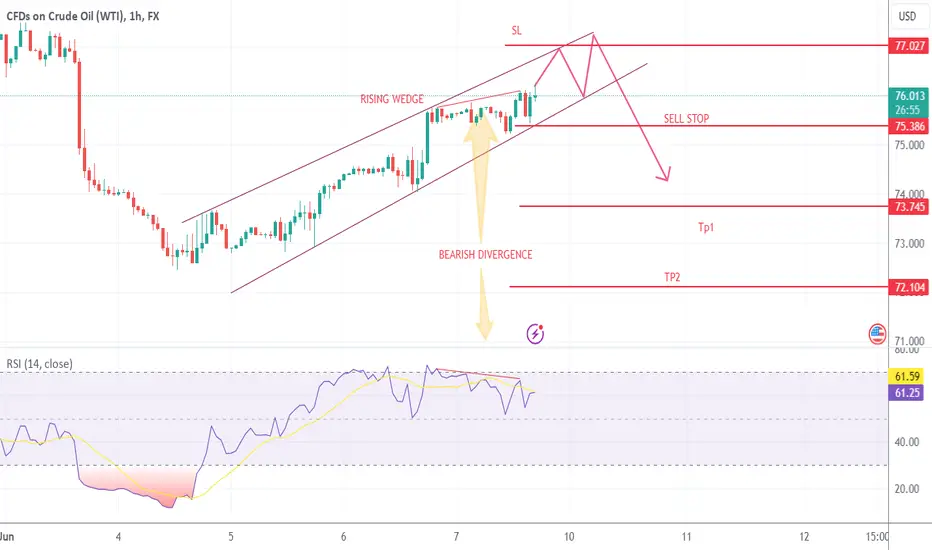
USOIL printing bearish reversalUSOIL WTI printing Rising WEDGE (bearish reversal) and Bearish Divergence
SELL STOP below the last HL, SL above the expected HH
TP 1 & TP2 with R:R 1:1 & 1:2 respectively
US-Oil will further push upside After Testing TrendlineHello Traders
In This Chart XTIUSD HOURLY Forex Forecast By FOREX PLANET
today XTIUSD analysis 👆
🟢This Chart includes_ (XTIUSD market update)
🟢What is The Next Opportunity on XTIUSD Market
🟢how to Enter to the Valid Entry With Assurance Profit
This CHART is For Trader's that Want to Improve Their Technical Analysis Skills and Their Trading By Understanding How To Analyze The Market Using Multiple Timeframes and Understanding The Bigger Picture on the Charts
