OPUSDTDear Respected Traders, we hope this communication finds you well.
we are convening a discussion focused on #OPUSDT
#OPUSDT is forming a “decending channel”pattern in the “4” hr time frame.
Soon we will see a bullish move of “70 %”
OPUSDT.PS trade ideas

OP TokenThe Optimism price retested its strong support mark of $2 and hovered in the bearish trajectory.
OP - Enjoy The Ride 🚗Hello TradingView Family / Fellow Traders. This is Richard, also known as theSignalyst.
📈 OP has been overall bullish, trading within the rising broadening wedge pattern in red.
Currently, OP is undergoing a correction phase and it is currently approaching the lower red trendline.
Moreover, it is retesting a strong support zone marked in blue.
🏹 Thus, the highlighted blue circle is a strong area to look for buy setups as it is the intersection of the blue support and lower red trendline acting as a non-horizontal support.
📚 As per my trading style:
As #OP approaches the blue circle zone, I will be looking for bullish reversal setups (like a double bottom pattern, trendline break , and so on...)
📚 Always follow your trading plan regarding entry, risk management, and trade management.
Good luck!
All Strategies Are Good; If Managed Properly!
~Rich

OPUSDT UPDATE #OPUSDT
UPDATE
Hey all friends and traders. Hope you are enjoying our analysis. we are here to analyze OPUSDT today.
OP is making Descending Channel has Already breakout in 12H time frame.
Retesting is in process✍
Expecting Massive Bullish wave📈

#OP/USDT breaks Diagonal Trendline heading towards a FVG in 30-M#OP/USDT breaks Diagonal Trendline heading towards a FVG in 30-Minut TF!
I'm opening a long position with tight stop loss and entries are around that FVG.

OP ANALYSIS🚀#OP Analysis : Breakout and Retest
🔮As we can see in the chart of #OP that there is a perfect breakout of trendline and retesting the trendline in 4he time frame. This indicates a potential bullish move.📈📈
🔰Current Price: $2.438
🎯 Target Price: $4.793
⚡️What to do ?
👀Keep an eye on #OP price action. We can trade according to the chart and make some profits⚡️⚡️
#OP #Cryptocurrency #TechnicalAnalysis #DYOR


OPUSDTOPUSDT was trading under the declining trendline. The price was reacting well the support and resistance of trendline
Currently the price has given the breakout from declining trendline with confluence to strong bullish divergence and now seems like the bulls are getting ready for some strong upside movement.
If the bulls sustain to upside the optimum target could be 4
What you guys think of this idea?

OP Short PositionOP Short Position
. Rejection From RESISTANCE ZONE 2.8
. Bearish Market Ahead : 30 April ... FOMC Meeting & Binance founder faces possible three-year jail term
Stop Loss : 2.81(9.6%)
Entry : 2.565
TP: 1.8 ( 33%)

OPUSD 1WOP ~ 1W 📈
#OP We will start making purchases gradually when retesting this support line. This is our first purchase. with a minimum target of 20%+


OPUSDT UPDATE#OPUSDT
UPDATE
Trying To Breakout Trendline In 12H Timeframe✅
In Case Of Successful Breakout Expecting Massive Bullish Wave Towards 4$ Soon✍️

OPUSDT IDEAHello Traders Hope You Are Enjoying Our Analysis. Today We Will Discuss About OP
(Update)
Trying To Breakout Trendline In 12H Timeframe✅
In Case Of Successful Breakout Expecting Massive Bullish Wave Towards 4$ Soon✍️

OPUSDT UPDATE #OPUSDT
UPDATE
Hey dear traders hope you are enjoying trading and analysis with our team. we are here to discuss about OPUSDT
OP is making falling wedge .it has already breakout in 12h time frame ✅
Expecting massive Bullish wave in coming days 📈
#OPUSDT #OP #OPBTC #BTC #Crypto #OP
CRYPTOCAP:ETHFI ASX:ATA $COMBO TSXV:SSV NASDAQ:OP SEED_ALEXDRAYM_SHORTINTEREST2:ONG IDX:STRK NYSE:AR SEED_DONKEYDAN_MARKET_CAP:BLUR LSE:SAGA

OPUSDT#OPUSDT
UPDATE
Trendline Breakout In 4H Timeframe✅
Incase Of Successful Breakout Expecting Massive Bullish Wave In Coming Days✍️

OPTIMISM 42724I gave a setup on OP against BTC earlier this am as I entered the trade. Jumped up but in reality, this could be just the beginning of a monster rally to 10 dollars. OP has held the ascending triangle as support and looks to be rallying. ANd why not? Ether prices are as broken as Bitcoin. I see a layer 2 and optimism has always been a monster mover.
I think this could be a safe trade with limited downside.NFA. I change my opinions as new data presents itself. I could just as easily take my profits and rotate out. It could also all go to zero, but I see way too much fear and I think many will chase ether gains but not want Ether.
BLackrock wants your OP and TAO

OP(Optimism) price action analysisSimilar scenario that the market has experienced
Example 1
💰DOT (spring-summer 2021)
Accumulation ➡️ Distribution ➡️ 67% dump ➡️ 360% pump
💰OP (spring-summer 2024)
Accumulation ➡️Distribution ➡️64% dump ➡️ projecting DOT scenario to OP
Here we saw 3 waves of decline and the last one was the most painful and fearful for the crowd. After that we had great pump
This scenario can be applied to many altcoins, not just OP.

#op Optimism has bounced from a support area👀 The key levels #op
Optimism has bounced from a support area👀
The key levels to watch are the descending resistance and the MA 200🔍
A solid breakout could lead to a bullish wave with a 100% upside potential✈️

OPUSDT 1D#OP has bounced from the support zone. The structure looks bullish. Let's see how it will play with dynamic resistance and daily MA200. In case of a solid breakout, we expect a 100% bullish wave. Targets are:
$2.833
$3.219
$3.657
$4.095
$4.719
$5.514

OP 21/04/2024OP is increased by 38% from the lowest daily imbalance. I have a diagonal below that can work as a support. We are currently above the weekly levels and price is targeting to fill the imbalances below. Every correction is a buying opportunity for me. If we drop to 2.20. It is good level to buy.

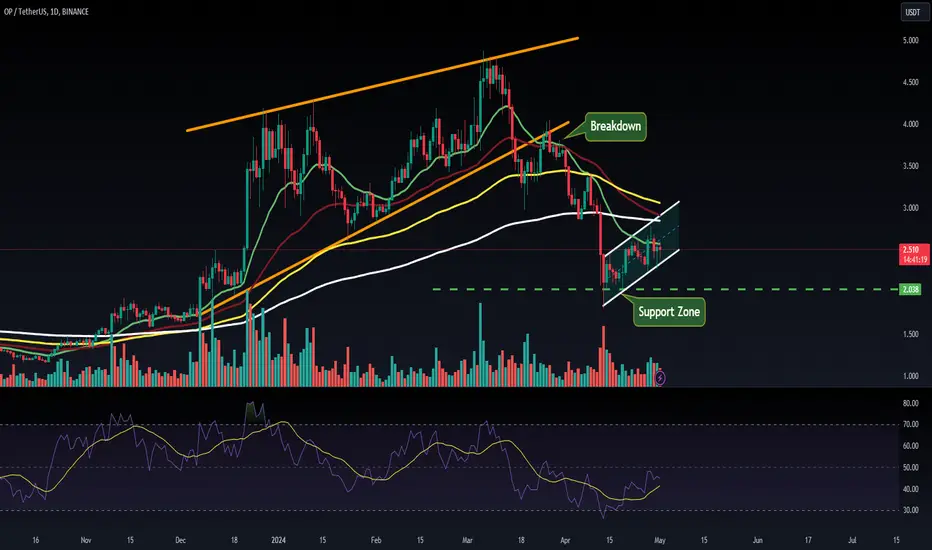
OPUSDT.1DThe daily chart for Optimism (OP/USDT) illustrates a bearish trend with a series of lower highs and lower lows, which can be interpreted as a downtrend channel. The price is currently hovering near $2.467, with a clear support level at $1.635. The resistance level at $4.139 is crucial; a breakout above this level could signal a potential trend reversal. However, the current price action remains below this resistance, suggesting that the bearish sentiment is still dominant.
Traders might look for short positions as long as the price is below the resistance level, with potential targets near the support level. A break above the resistance could invalidate the bearish outlook and shift the strategy towards looking for buying opportunities. Risk management is key, and stop losses should be considered above the resistance level when taking short positions to protect against sudden bullish reversals.
