Long at Nikkei! Banzai !! BanZaiNikkei 225 is gonna explode beyond 24,000 resistance level for a longer period perspective
NK225MM2020 trade ideas

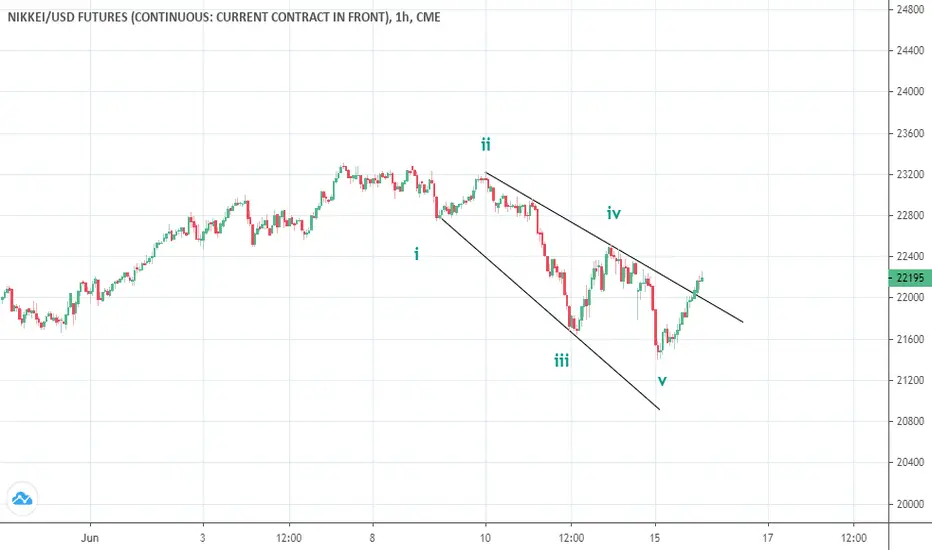
Elliott Wave View: Nikkei (NKD_F) Extending HigherElliott Wave View in Nikkei Futures (NKD_F) suggests the Index has just broken above June 5 high, suggesting the cycle from March low remains alive and the Index has resumed higher. The break higher is likely still part of wave ((5)) of the same cycle from March low. Shorter cycle, 1 hour chart below shows pullback to 21705 ended wave (2). Up from there, the Index ended wave 1 at 22655 high. The internal subdivision of wave 1 unfolded as 5 waves impulse Elliott Wave Structure. Wave ((i)) of 1 ended at 22005 high and wave ((ii)) pullback ended at 21800 low. Rally higher in wave ((iii)) then ended at 22405 high, followed by wave ((iv)) pullback which ended at 22340 low. Wave ((v)) then extended higher and ended at 22655 high. Afterwards, the Index did a pullback in wave 2, which ended at 22205 low.
From there, the Index has extended higher in wave 3. Up from wave 2 low, wave ((i)) ended at 22535 high and wave ((ii)) dips ended at 22345 low. Index then extended higher in wave ((iii)) towards 22960 high. The pullback in wave ((iv)) ended at 22670 low. The index can still see another high before ending wave ((v)). This would end wave 3 in the higher degree. Index then could correct within wave 4 before resuming higher again. The latest rally has broken above previous wave 1 high to confirm that the leg higher is already in progress. While pullback stays above 22205 low, expect the dips in 3,7 or 11 swings to find support for more upside.


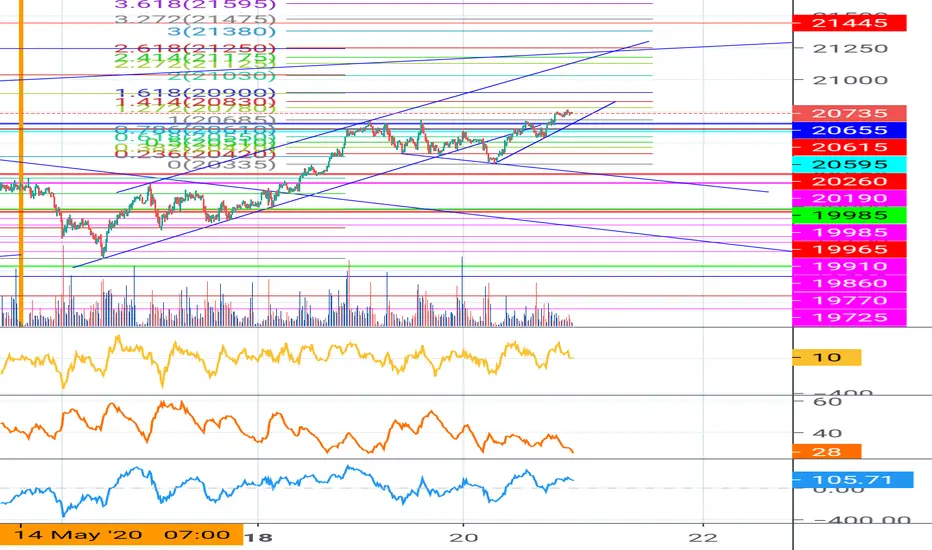
Elliott Wave View: Further Upside in NikkeiShort term Elliott Wave view of Nikkei (NKD_F) suggests that the rally from 5.14.2020 low is unfolding as a 5 waves impulsive Elliott Wave structure. Up from 5.14.2020 low, wave (1) ended at 20830 and pullback in wave (2) ended at 20247 as chart below shows. Internal of wave (2) unfolded as a double three (double zigzag). Down from wave (1) at 20830, Wave W ended at 20515 as a zigzag, wave X ended at 20685, and wave Y lower ended at 20245 as a zigzag.
Index then resumed higher in wave 3 which ended at 21730. Subdivision of wave 3 unfolded as another 5 waves in lesser degree. Up from wave (2) at 20247, wave 1 ended at 20550 and wave 2 ended at 20465. Wave 3 ended at 21370, wave 4 ended at 21150, and wave 5 of (3) ended at 21730. Pullback in wave (4) is proposed complete at 21410 and Index has resumed higher by breaking above wave (3) again. Near term, while pullback stays above wave (4) low at 21410, but more importantly above wave (2) low at 20247, expect Index to extend higher. As far as pivot at 20247 low stays intact, dips should find buyers in 3, 7, or 11 swing for further upside.


Long 6J or short NKD based on NKD price action and volumeNKD (CME NIKKEI Fututes) price is inversely correlated with the Yen.This is the opposite of the relationship with most currencies andthe equities market of the respective country. Volume has declined,and it's likely that it will push 6J (CME Yen Futures) between .0093300 and .0093600


Nikkei 225 futures (Nikkei) - WXY wave pattern Nikkei 225 futures (Nikkei) is moving down in WXY wave pattern as complex correction. Wave X was over in wxy correction. Y wave is in progress, which dropped in wave 1 (or A) and corrected by wave 2 (or B). The 3rd (or C) wave will start down.
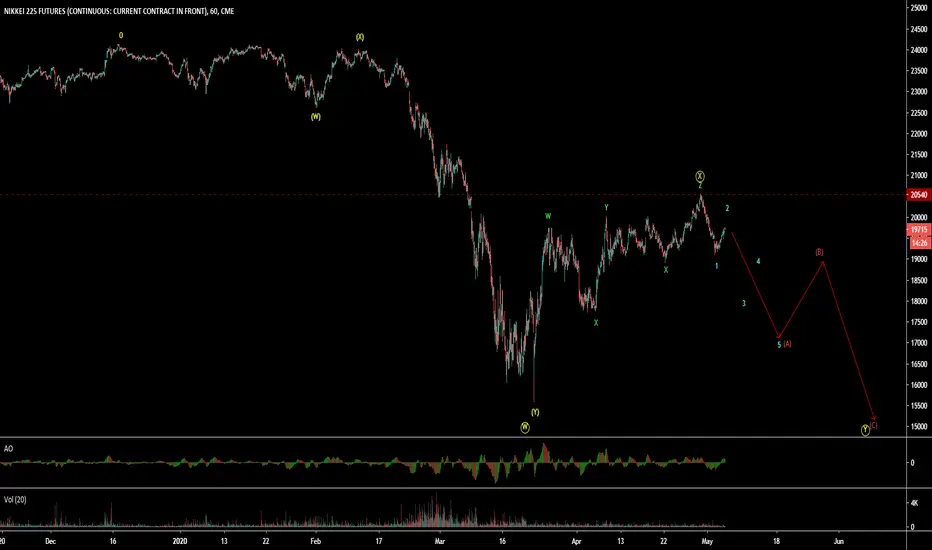
NIKKEI - ABC flat wave patternNIKKEI futures current contract is making ABC flat corrective pattern. B is about to over and C wave will start soon.


