Baidu -the awakening of the Chinese giantBaidu (BIDU) has been moving within a descending channel, and the price is now testing the lower boundary of a key demand zone. On the monthly chart, the stock is attempting to hold above the 115–120 range, which could signal the beginning of a mid-term reversal. The upside potential extends toward
Next report date
—
Report period
—
EPS estimate
—
Revenue estimate
—
1.36 USD
3.23 B USD
18.57 B USD
2.07 B
About Baidu, Inc. Sponsored ADR Class A
Sector
Industry
CEO
Yan Hong Li
Website
Headquarters
Beijing
Founded
2000
ISIN
KYG070341048
FIGI
BBG010Z7R2P3
Baidu, Inc. engages in the provision of internet search and online marketing solutions. The firm’s products and services include Baidu App, Baidu Search, Baidu Feed, Haokan, Quanmin, Baidu Post Bar, Baidu Knows, Baidu Encyclopedia, Baidu Input Method Editor or Baidu IME, Baidu AI Cloud and Overseas Products. It operates through the following segments: Baidu Core and iQIYI. The Baidu Core segment provides search-based, feed-based, and other online marketing services. The iQiyi segment is an online entertainment service provider, which offers original, professionally produced and partner-generated content on its platform. The company was founded by Yanhong Li and Xu Yong on January 18, 2000 and is headquartered in Beijing, China.
Related stocks

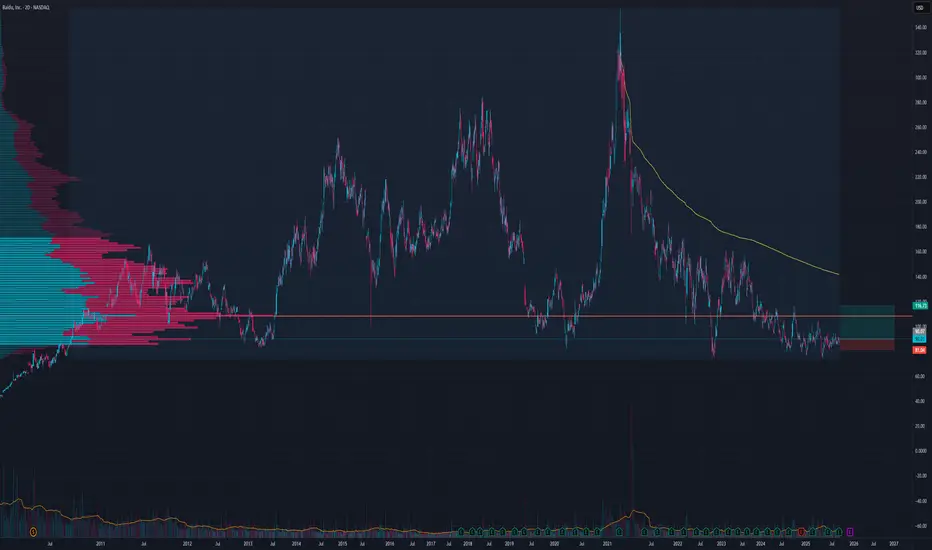
BIDU - Road to recovery=======
Volume
=======
- decreasing
==========
Price Action
==========
- Broken out of 4 year downtrend
=================
Technical Indicators
=================
- Ichimoku
>>> price above cloud
>>> Green kumo contracting slightly
>>> Tenken - Above clouds
>>> Kijun - Above clouds
>>> Chiku -

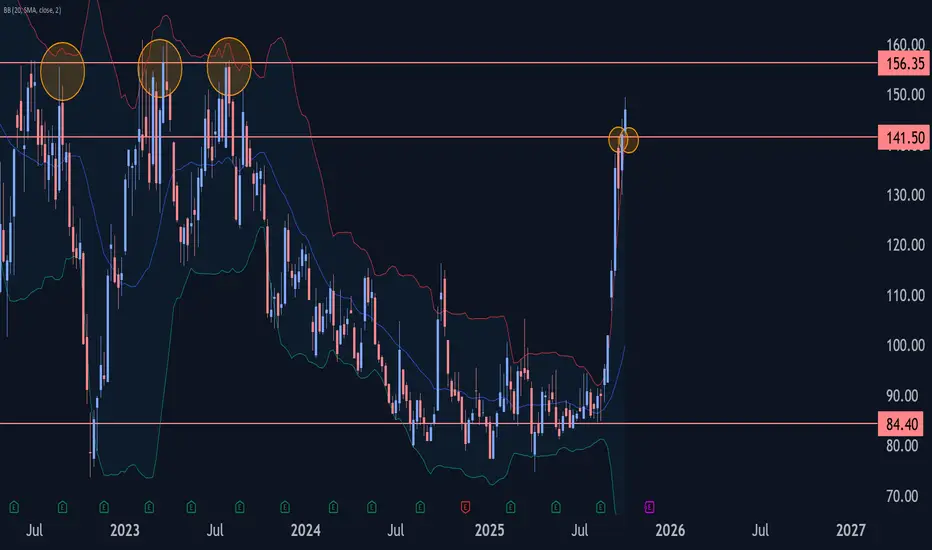
Baidu Wave Analysis – 6 October 2025
- Baidu rising inside weekly impulse wave C
- Likely to rise to resistance level 156.35
Baidu recently reversed up from the key support level 141.50 (former monthly high from September, acting as the support after it was broken).
The upward reversal from the support level 141.50 continues the ac
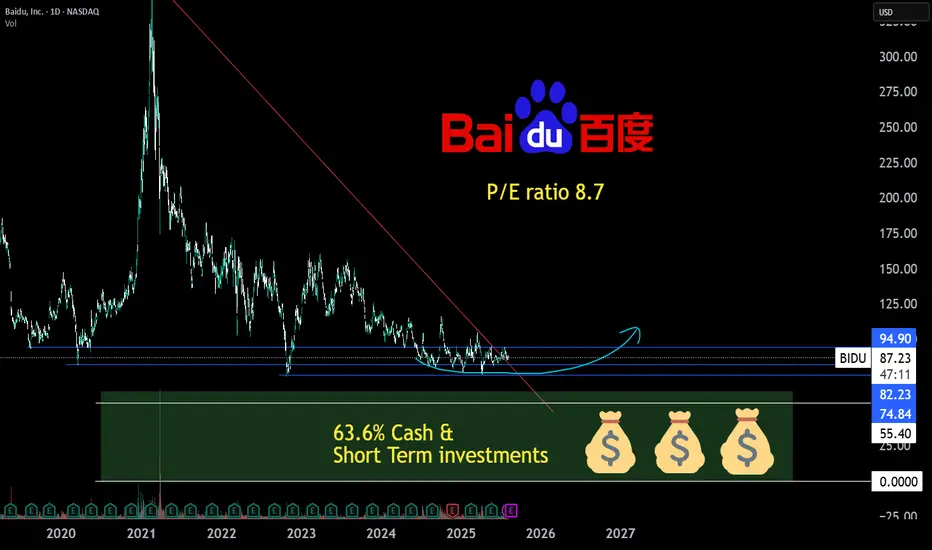
BAIDU 63.6% cash & short term inv., P/E 8.7,possible rotation TABaidu largest search engine in china but way less monopoly in china, there is also bing.
Baidu invests heavily in AI and autonomous driving by apollo go.
China economy is in deleveraging and seems to start growing again.
China devlation problems comapnies sitting on cash.
Baidu advertisment income w
BIDU Long TradeSeems good here, buying at market on Monday but prefer lower to flat price
SL at 81
TP at 116.73
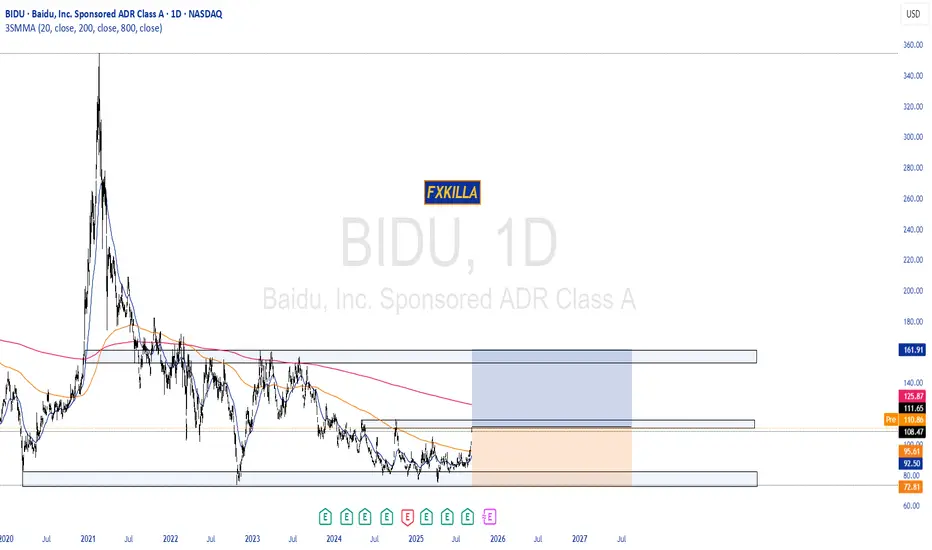
BAIDU HIGH PROBABILITY SETUP SOON!!!🚨 BIDU HIGH PROBABILITY BUY SETUP 🚨
* Here We Can See Clearly The Next Potential Move For BIDU Coming Hours/Days.
* Keep Your Eyes Close On Your Trading Positions.
* Happy PIP Hunting Traders.
FXKILLA.
BIDU 1D: triangle breakoutBIDU 1D: triangle breakout + real-world AI deployment boosts bulls
Baidu (BIDU) breaks out of a triangle within a falling channel on the daily chart, with solid volume, reclaim of the 50MA, and approach to the 200MA. $90.09 flips into support. Targets stretch to $105.47 / $113.68 / $124.06 (Fibo l

BIDU Daily Outlook – Smart Money Play in Motion🔹 Key Observations:
Clear Break of Structure (BOS) to the upside, signaling bullish intent.
Volume spikes confirm institutional activity around recent lows.
Fib extension targets align with supply zones at $95.23 – $105.19.
If $105 breaks, the liquidity pocket toward $115.73 opens up.
🔹 Levels

Baidu | BIDU | Long at $82.50Baidu NASDAQ:BIDU - the Google of China. This one is being ignored by AI investors, and may be an opportunity. Maybe... nothing is certain (especially with the "risks" of Chinese investments).
P/E = 9x
Debt/Equity = 0.27x
Price/Sales = 1.55x
Price/Book = 0.80x
Price/Cash flow = 7.59x

BIDU - LongI wanna say we are seeing a rotation into Chinese stocks, but not really sure. Looking at BIDU and BABA on the weekly, they looked primed. I am currently in this trade, but it looks to have some promising upside.

See all ideas
Summarizing what the indicators are suggesting.
Neutral
SellBuy
Strong sellStrong buy
Strong sellSellNeutralBuyStrong buy
Neutral
SellBuy
Strong sellStrong buy
Strong sellSellNeutralBuyStrong buy
Neutral
SellBuy
Strong sellStrong buy
Strong sellSellNeutralBuyStrong buy
An aggregate view of professional's ratings.
Neutral
SellBuy
Strong sellStrong buy
Strong sellSellNeutralBuyStrong buy
Neutral
SellBuy
Strong sellStrong buy
Strong sellSellNeutralBuyStrong buy
Neutral
SellBuy
Strong sellStrong buy
Strong sellSellNeutralBuyStrong buy
Displays a symbol's price movements over previous years to identify recurring trends.
Curated watchlists where BAIDF is featured.

Frequently Asked Questions
The current price of BAIDF is 16.31 USD — it has increased by 5.95% in the past 24 hours. Watch Baidu, Inc. stock price performance more closely on the chart.
Depending on the exchange, the stock ticker may vary. For instance, on OTC exchange Baidu, Inc. stocks are traded under the ticker BAIDF.
BAIDF stock has risen by 4.69% compared to the previous week, the month change is a −3.95% fall, over the last year Baidu, Inc. has showed a 55.29% increase.
We've gathered analysts' opinions on Baidu, Inc. future price: according to them, BAIDF price has a max estimate of 30.42 USD and a min estimate of 10.42 USD. Watch BAIDF chart and read a more detailed Baidu, Inc. stock forecast: see what analysts think of Baidu, Inc. and suggest that you do with its stocks.
BAIDF reached its all-time high on Aug 26, 2022 with the price of 22.50 USD, and its all-time low was 9.21 USD and was reached on May 8, 2025. View more price dynamics on BAIDF chart.
See other stocks reaching their highest and lowest prices.
See other stocks reaching their highest and lowest prices.
BAIDF stock is 5.61% volatile and has beta coefficient of −0.20. Track Baidu, Inc. stock price on the chart and check out the list of the most volatile stocks — is Baidu, Inc. there?
Today Baidu, Inc. has the market capitalization of 40.35 B, it has decreased by −1.87% over the last week.
Yes, you can track Baidu, Inc. financials in yearly and quarterly reports right on TradingView.
Baidu, Inc. is going to release the next earnings report on Nov 18, 2025. Keep track of upcoming events with our Earnings Calendar.
BAIDF earnings for the last quarter are 0.24 USD per share, whereas the estimation was 0.23 USD resulting in a 2.50% surprise. The estimated earnings for the next quarter are 0.14 USD per share. See more details about Baidu, Inc. earnings.
Baidu, Inc. revenue for the last quarter amounts to 4.53 B USD, despite the estimated figure of 4.56 B USD. In the next quarter, revenue is expected to reach 4.31 B USD.
BAIDF net income for the last quarter is 1.01 B USD, while the quarter before that showed 1.06 B USD of net income which accounts for −5.09% change. Track more Baidu, Inc. financial stats to get the full picture.
No, BAIDF doesn't pay any dividends to its shareholders. But don't worry, we've prepared a list of high-dividend stocks for you.
As of Nov 3, 2025, the company has 41.3 K employees. See our rating of the largest employees — is Baidu, Inc. on this list?
EBITDA measures a company's operating performance, its growth signifies an improvement in the efficiency of a company. Baidu, Inc. EBITDA is 3.50 B USD, and current EBITDA margin is 27.00%. See more stats in Baidu, Inc. financial statements.
Like other stocks, BAIDF shares are traded on stock exchanges, e.g. Nasdaq, Nyse, Euronext, and the easiest way to buy them is through an online stock broker. To do this, you need to open an account and follow a broker's procedures, then start trading. You can trade Baidu, Inc. stock right from TradingView charts — choose your broker and connect to your account.
Investing in stocks requires a comprehensive research: you should carefully study all the available data, e.g. company's financials, related news, and its technical analysis. So Baidu, Inc. technincal analysis shows the buy rating today, and its 1 week rating is strong buy. Since market conditions are prone to changes, it's worth looking a bit further into the future — according to the 1 month rating Baidu, Inc. stock shows the buy signal. See more of Baidu, Inc. technicals for a more comprehensive analysis.
If you're still not sure, try looking for inspiration in our curated watchlists.
If you're still not sure, try looking for inspiration in our curated watchlists.