BBD.B - Bullish here with Engulfing candleBBD.B - Bothing fancy here. Everything comes across as a bullish reversal at the moment.
BDRBF trade ideas

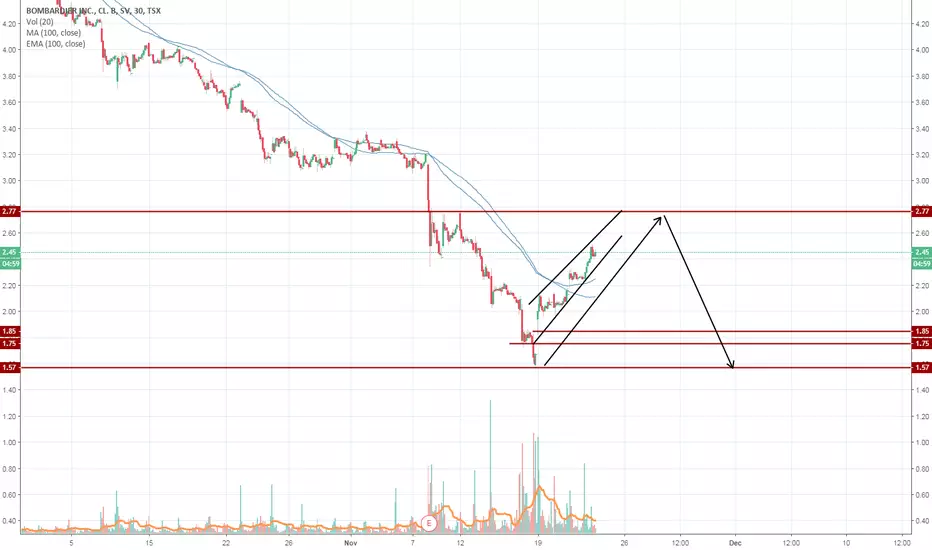
BBD.B false break of support $2.00 Trapping Go Long $1.75Gap up Monday Morning,
A test of Resistance $2.15
A bounce off and back down to test Support $2.00
Support fails and signals continued down trend
Downtrend also fails and traps those who short at break of support.
Price heads long @ $1.75 Start of long term uptrend Monthly Chart time frame Entry on the D1 chart.

BBD.B - Triangle pattern breaching downtrend. Neutral Bullish.BBD.B - Neutral bullish here. Triangle pattern upside being testing while breaking moderate resistance. RSI looks healthy and room to run. Gap overhead. Would like to see some more volume come in however I find it bullish at the moment while mindful of possible false breakout.

Neutral but on watch.Neutral here but see a pattern forming and waiting for break to the upside or downside to make a decision.

BBD.BA good example of a situation where MFI takes precedence over a simple RSI. RSI shows positive divergence while MFI showing negative money flow.
Looking for a short term bounce but I'd stay away from it long term as they do have considerable debt.

BBD LongBuy BBD in anticipation of breakout, with negative news of Boeing being a catalyst to push through the resistance at $3


previous target hit into shortBBD long closed at 2.70.
Now looking to short back to resistance at 1.6


Bombardier : out of day RSI (20) without the usual Vol Boost Les Affaires gave a analysis of BBD.A last friday witch i agree on
www.lesaffaires.com
It's gonna go back at 5,50$ at some point.
For now we can expect a under 2$ drop before heading to that point.
My guest is that focus on the market is elsewhere and people could see Bombardier like something with more potential then any tech stock now.
So we may be out of that RSI low (day 20)
and we didn't yet see that 2 consecutive volume in the green with second one higher
normaly after a RSI drop we see that and a price move up of about 10%.
my guest is that we're gonna see that 2,15-2,20 resistence becoming a 2,60 soon.

BBD.B ShortMomentum has full crossed point in the downward direction. As well as ichimoku cloud showing red symbolizing a short trend. for additional conformation day chart has been red for 4 straight days.


ready to close longs into shortretrace happened way faster than expected. almost 80% profits on this.
close long and short at resistance
BOMBARDIER LOOKS READY FOR A BOUNCE OVER THE NEAR TERM Over the last 3 years, Bombardier Relative Strength (14) has hit a peak of at least 70 **AFTER** hitting a low of 31 or lower. This chart shows roughly the relationship between share price & RSI as well as the "behavior" of these technical tools through the last 7 times this scenario has occurred.


dead cat bounceMost would be looking to short here due to the breakdown and apparent short term consolidation happening under the critical price line.
However parabolic move down plus RSI extremely overextended tells me were in for a possible sharp incline. risky and volatile so relatively tight stops here.

Watch for BOMBardier gapfill.Comments are in the chart...I have no position FYI just applying my SPX gapfill trading crap to this thing.


Bombardier: Planes! Trains! Snowmobiles!neutral to favorable on abstract fundamentals of this company
corporate governance and geo-political factors are moderately bullish
upward oil price/ volatility creates catalyst for Bombardier fuel efficient/ electric products


Watch BOMBARDIER - ChannelTechnicals - Bombardier is in a parallel channel. The upper limit and 180EMA are overlapping and form a strong resistance. Price could bounce down, or break above and get a good run-up. If it happens to go up, it could go back to recent highs around 5.40. I am just waiting for a trend confirmation to get into the trade.
Fundamentals - Bombardier made good progress on their airplane sales, especially with their C-Series planes. However, in a recent article, Financial Times warned about the difficulties the company has with railways products. In addition, the Motley Fool described Bombardier as a "shaky" investment as of now.
Remember that the stock was trading as low as $0.80 in 2016. Such an improvement in this industry is huge. That is why I advise caution if you want to go long.
Trade safe!
