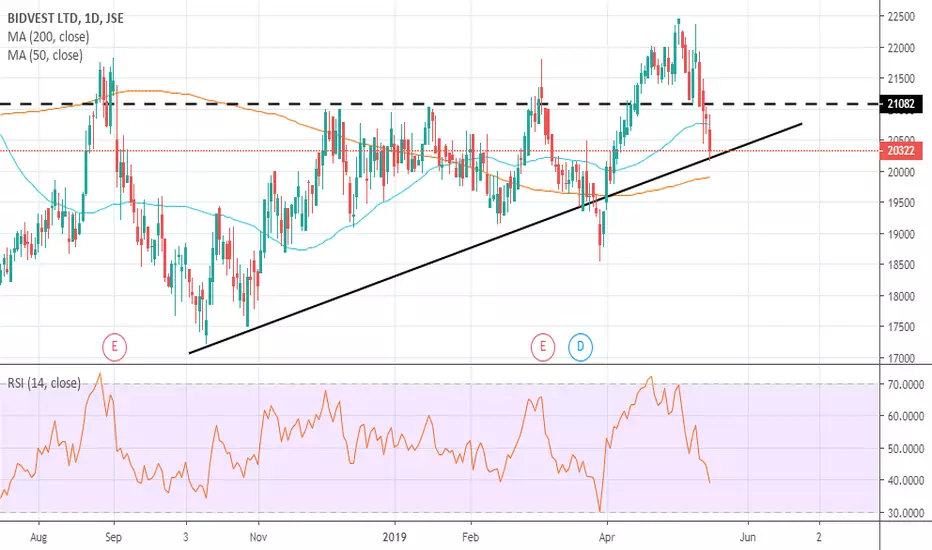
Bidvest ReversalJSE:BVT has broken through an ascending support level and is looking good for a short position once it breaks through the fractal level of 5th of June.
BDVSF trade ideas

$JSEBVT Bidvest. Catching a break off support.Bouncing off support. Targets could be 210 & 218. Weak markets could stifle this attempt. Stick to stop losses.

BIDVEST Descending Resistance Breakout & ConfirmationJSE:BVT has broken through the descending resistance and has confirmed the breakout.
We can expect a move towards the resistance level around the 21000 level.
For the cautious trader, you can wait for it to break through the fractal or for the more aggressive trader, you could enter immediately.

Possible buy on Bidvest LtdFor the best part of the last six months, Bidvest Ltd has been trading in sideways range of between R212 and R192.
It recently broke above R212, going all the way up to R224.58 but didn't manage to hold the level. The stock is now trading back at support around R192. It is interesting to note, while the stock is sitting on support, the Slow Stochastic is also indicating the stock is oversold.
For this reason, I would be looking to buy now with the idea of selling as the stock makes it's way back to the upper resistance level.
Action: Place a Limit Order to go LONG with your Limit Price set to R195.00. Set your Stop Loss to R184.00 and your Take Profits to R205.00 and/or R212.00.

Bidvest on incline support on the DailyBVT has broken below the R210 support (previous resistance).
Price is now approaching incline support around the R202 area. Just below it is the 200dma at R199.
I’m expecting those 2 levels to hold for a bounce.
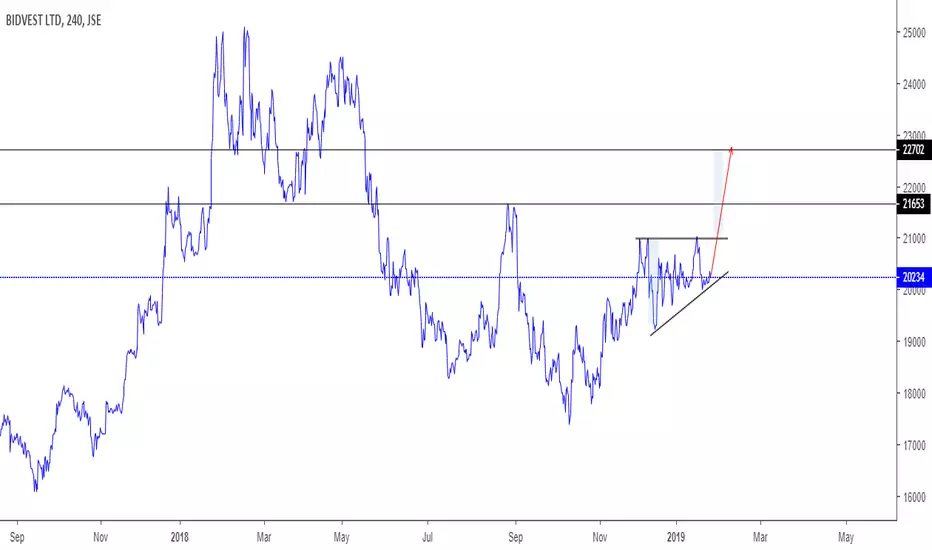
LONG BIDVESTLooking to get long on Bidvest at the pivot
The VPVR indicates that we in an accumulation range and i have an expectation we break higher
The POC will be a strong level Stops under the POC

BIDVEST GROUP LIMITED (BVT) 4-HOUR TIMEFRAMEPrice is currently stuck in a small range with support at 18 300 and resistance at 21 920. This will be a risky trade (not that there is no trade without risk) because we will be going against the trend. However, the risk reward of 4.33 gives me the confidence to still take on this position. My entry will be at 21 550. Break a chart!

BVT SHORT TERM BEARISHRight guys it slipped my mind to pay my Pro account so I've been fighting pop-ups like a madman to bring you this analysis.
Lets get going.
WEEKLY
#A
-In #A we can see a rally on (slightly) declining volume after a bounce of the 18055 mark. Looking down at the DMI indicator it looks like its more a case of the bears losing power than the bulls convincingly overpowering them.
#B
-In section #B, We have a sudden drop in volume, a subsequent rally in volume, but price not reflecting the same action, and seems to be milling. The DMI indicator shows no clear winner, even with volume increasing massively.
#C
-A rally, on the back of heavy declining volume
-The DMI Iis showing a spike in +DI, but is seems so be more because of a lack of bears (-DI) than convincing bulls.
LOOKING CLOSER TO THE DAILY TIMEFRAME:
#D
-In #D we have the collapse in volume, followed by the extreme rally in volume we observed in the Weekly chart.
- (1 ) I think is of quite some importance: Here we have a spike in volume, with a green candle with a long upper wick - this means that price went up substantially, with the bears beating it back down by almost 50% of the candle. Following that we have a uncertainty doji, and then a big red bar with very little volume, showing that the bears where able to push the price down from up high with minimal effort.
#E
- Following this event, bears beat the price down to support, where is rallied with a somewhat convincing volume pattern, but looking down at the DMI it can be seen that it was another case of the bears giving it to the bulls rather than the bulls taking it.
#F
- IN #F, we have event (2) , a candle that shows how the price went high, and was once again beat down substantially by the bears at a major supply zone - leading to a retest of demand on increasing volume (another sign of weakness)
#G
- THE KICKER:
a Major rally, on major declining volume, with the bulls showing major instability on the DMI at (3) .
THANKS FOR THE READ EVERYONE - PLEASE COMMENT THOUGHTS, IDEAS, COMPLAINTS, PROBLEMS, OBJECTIONS OR SOLUTIONS.
Time to go pay that damn bill Oanda is driving me up the wall.

Sideways channel on BidvestJSE:BVT is trading in a sideways channel and has been since mid-November last year. It has reached the top of the channel and will most likely bounce on the resistance and continue downwards. I will enter a short around the 21600 level if it goes down.
Our target level will be the bottom of the channel around the 19000 level, which is also a significant level because round numbers tend to act like magnets for the price action.
If it fails to bounce off and breaks through the resistance, I will consider entering a long position.

$JSEBVT Bidvest stuck in a BOX. To resist again?Bidvest has been trading in this box since November last year with two failed breakouts on both the upper and lower end. Other than those two fake breaks, action has been contained pretty much between R192 - R210. Without any positive news flow in the next couple of days/weeks there is a good chance this R210 level could resist again. If we see a reversal off R210, look for a retest of the lower end of the box and a closure of the gap at R193.50.

The Bidvest group#Daily chart: Price approaching the R210 resistance area which has been holding since at least November 2018 (save for that March 2019 results induced spike).
Will the resistance still hold? I’m expecting it to.

Reversal on BidvestJSE:BVT has formed a "open/close above stomach" pattern which is a strong reversal signal.
It works as follows: After preceding downtrend, the second candle opens and closes above 50% of the long red body.
Along with today's upward movement, we can expect it to reach our target at the next resistance level

$JSE-BVTJSE:BVT
Testing trend line that started in October 2018.
Important level is 19000 if that is broken target is around 17500

$JSE-BVTJSE:BVT
Held 21900 level and now pulled back towards up trend line.
Watch for break one way or the other.

JSE:BVT Bidvest DistributionBidvest has broken the ascending stride and retested it. There is negative divergence indicating a continuation of the new downward trend. The smaller trading range (TR) on the daily also indicates that this is distribution and we can expect a test to the recent lows and possibly the demand line of the descending stride.

Bidvest Correction Is Not Complete YetFounded by entrepreneur Brian Joffe in South Africa in 1988, Bidvest Group Limited is a well known international trading, services and distribution company which first listed shares for sale on the Johannesburg Stock Exchange (JSE) in 1990. The group either owns or has significant holdings in about 300 companies, with a portfolio of assets that spans five continents and an employee complement of just over 141 000 people worldwide.
Technicals
I don't believe that the full correction has completed as yet and expect to see a 61.8% Fib retracement from the low before there will be another wave to the downside. This correction will likely end after 3 waves but the possibility of 5 does exist. Once the correction is complete, there are very large targets to the upside.


Pairs idea +IPL / -BVTsome recent chatter in the Unum Trading room:
"Can you please have a look at +IPL/-BVT? The gap appears wide relative to historical performance. " @Lester_Davids
"Yes, I picked this up two weeks ago, and not going that great so far. Also waiting for this gap to close." @michaelporter
"Thanks Michael. IPL seems to be forming a double bottom developing, so we may be nearing the end of the decoupling. " @lester_davids
"A small move starting. IPL + 3.4% / BVT -1.25%" @lester_davids
Having a look at the relative chart, it looks like the pair +IPL/-BVT is starting to converge.

+IPL/-BVT pairThere was some recent chatter in our trading room about this pair:
"Can you please have a look at +IPL/-BVT? The gap appears wide relative to historical performance." @lester_davids
"Yes, I picked this up two weeks ago, and not going that great so far. Also waiting for this gap to close." @michaelporter
Looking at the relative it looks like the pair is starting to converge .... possibly worth a trade.
