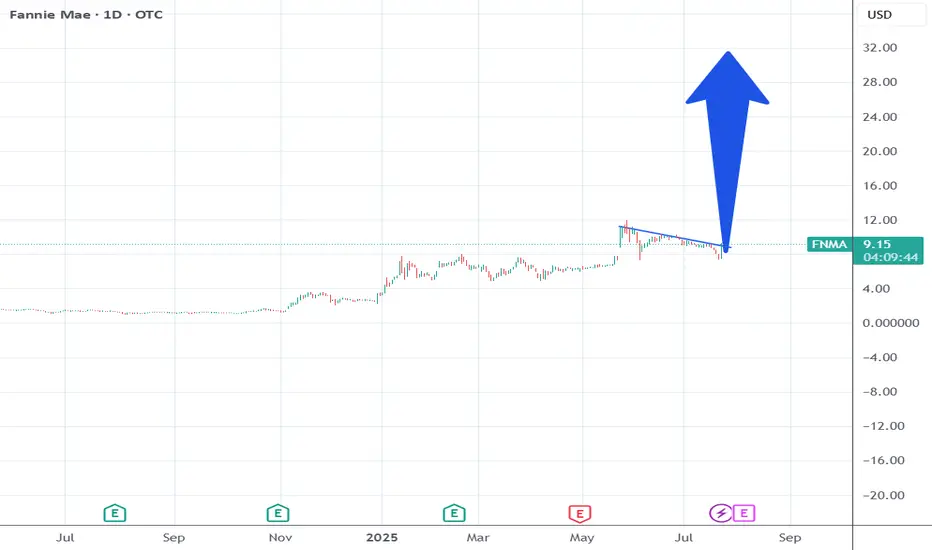
Fannie Mae FNMAIf FNMA moves from $10 to $20, that would be a 100% gain. Do you think that is possible? How long might that take on a Daily chart?
Next report date
—
Report period
—
EPS estimate
—
Revenue estimate
—
27,500,000.00
0.00 USD
16.98 B USD
151.42 B USD
1.16 B
About Fannie Mae
Sector
Industry
CEO
Peter Akwaboah
Website
Headquarters
Washington
Founded
1938
ISIN
US3135868103
FIGI
BBG0000084J1
Federal National Mortgage Association is a government-sponsored company, which engages in the provision of liquidity for purchases of homes and financing of multifamily rental housing and refinancing existing mortgages. It operates through the Single-Family and Multifamily segments. The Single-Family segment offers liquidity to the mortgage market and increases the availability and affordability of housing for single families. The Multifamily segment includes guaranty fees on mortgages and on multifamily mortgage loans. The company was founded in 1938 and is headquartered in Washington, DC.
Related stocks

UGLY! FNMA Collapse! We Are in a Recession!The recession began in earnest in late 2022.
Subsequently, in March 2023, Silicone Valley Bank was wiped out; the feds took over and now here we are on the other side of the expansionary cycle. As it currently stands, banks are still sitting on hundreds of billions in unrealized losses.
This can

Fannie Mae (FNMA) AnalysisCompany Overview:
Fannie Mae OTC:FNMA , the government-sponsored enterprise (GSE), plays a critical role in supporting the U.S. housing market through mortgage liquidity and stability.
Key Catalysts:
Q2 2025 support: Provided $102B in liquidity, helping 381,000 households—with over 50% being fir

Trump will approve the FNMA privatization within 10 days.Trump works for Wall St. He plans his moves based on what Wall St wants.
He says stuff at certain times to get the markets to react in key times for Wall St.
The overall market is going to correct within the next 30 days.
FNMA just did a shakeout the last 3 weeks.
So Trump will time his announce
Fannie Mae Breaking out?Is Fannie Mae set for a big breakout? Price is above the 100(Yellow) and 200 (Blue) EMAs. Price is trending in an upward direction. Will more news

FNMA: great looking consolidation Price is showing impressive relative strength during recent market weakness with 3 weeks of tight closes
• W-bottom structure forming
• Fund accumulation increasing
• EPS estimates for 2025–26 rising sharply
• Regulative catalyst + Bill Ackman backing
Next mid-term resistance zone: 12–16
Macro/Wee
FNMA looks like a Crypto Meme coin...FNMA looks like a crypto meme coin that just got done with a long accumulation after going through a rug pull... except this rug is the 2007-2008 crash, and the accumulation time is 17 years!!! This is a big moment on the chart, I don't think this is any ordinary breakout. This is a monumental momen

FNMA near term resistance possibleFNMA daily update
Government has determined a path to release from conservatorship, if this happens then this stock will be relisted and be worth a lot more than the current value
At present the stock is nearing a short to medium term resistance level using elliot wave and fibonacci/ harmonics bet

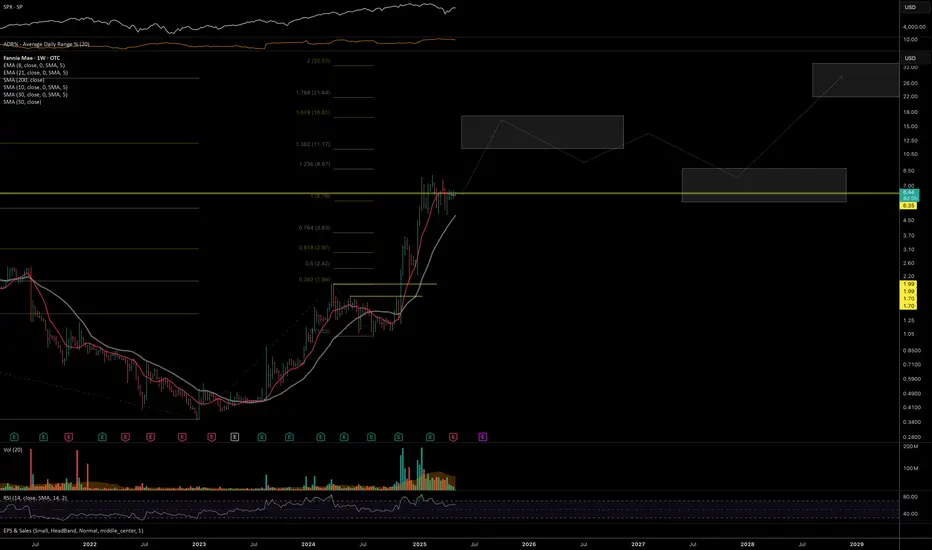
FNMA Daily wave 5 projection3x potential ends of wave 5s,
Likely to see some significant moves up to finish a wave
It will be interesting to see what happens from there but I suspect there will be some retracement and possible complex correction for quite a while before pushing higher
The triangle is over a decade long... so

FNMA Weekly UpdateLooking for another push into an intermediate term wave 5, see lower timeframe view
Supply level is close to a fib projection cluster level so may see some resistance there or profit taking...

See all ideas
Summarizing what the indicators are suggesting.
Oscillators
Neutral
SellBuy
Strong sellStrong buy
Strong sellSellNeutralBuyStrong buy
Oscillators
Neutral
SellBuy
Strong sellStrong buy
Strong sellSellNeutralBuyStrong buy
Summary
Neutral
SellBuy
Strong sellStrong buy
Strong sellSellNeutralBuyStrong buy
Summary
Neutral
SellBuy
Strong sellStrong buy
Strong sellSellNeutralBuyStrong buy
Summary
Neutral
SellBuy
Strong sellStrong buy
Strong sellSellNeutralBuyStrong buy
Moving Averages
Neutral
SellBuy
Strong sellStrong buy
Strong sellSellNeutralBuyStrong buy
Moving Averages
Neutral
SellBuy
Strong sellStrong buy
Strong sellSellNeutralBuyStrong buy
Displays a symbol's price movements over previous years to identify recurring trends.
FNMA5077242
Federal National Mortgage Association 0.6% 25-NOV-2025Yield to maturity
11.60%
Maturity date
Nov 25, 2025
FNMA5078051
Federal National Mortgage Association 0.625% 25-NOV-2025Yield to maturity
5.40%
Maturity date
Nov 25, 2025
FNMA5076378
Federal National Mortgage Association 1.6% 16-NOV-2035Yield to maturity
5.07%
Maturity date
Nov 16, 2035
FNMA5066579
Federal National Mortgage Association 1.55% 26-OCT-2035Yield to maturity
5.01%
Maturity date
Oct 26, 2035
FNMA5841324
Federal National Mortgage Association 5.05% 26-JUN-2029Yield to maturity
5.01%
Maturity date
Jun 26, 2029
FNMA6005537
Federal National Mortgage Association 5.02% 13-FEB-2030Yield to maturity
5.00%
Maturity date
Feb 13, 2030
FNMA6004285
Federal National Mortgage Association 5.0% 21-FEB-2030Yield to maturity
5.00%
Maturity date
Feb 21, 2030
FNMA5040677
Federal National Mortgage Association 1.625% 24-AUG-2035Yield to maturity
4.99%
Maturity date
Aug 24, 2035
FNMA5986879
Federal National Mortgage Association 5.0% 16-JAN-2030Yield to maturity
4.98%
Maturity date
Jan 16, 2030
FNMA5977403
Federal National Mortgage Association 5.0% 09-JAN-2030Yield to maturity
4.98%
Maturity date
Jan 9, 2030
FNMA5093452
Federal National Mortgage Association 0.57% 29-DEC-2025Yield to maturity
4.96%
Maturity date
Dec 29, 2025
See all FNMFO bonds
Frequently Asked Questions
The current price of FNMFO is 54,900.00 USD — it has decreased by −0.18% in the past 24 hours. Watch Fannie Mae stock price performance more closely on the chart.
Depending on the exchange, the stock ticker may vary. For instance, on OTC exchange Fannie Mae stocks are traded under the ticker FNMFO.
FNMFO stock has fallen by −0.18% compared to the previous week, the month change is a −0.18% fall, over the last year Fannie Mae has showed a 292.14% increase.
FNMFO reached its all-time high on Jan 12, 2005 with the price of 104,440.00 USD, and its all-time low was 3.50 USD and was reached on Jan 31, 2011. View more price dynamics on FNMFO chart.
See other stocks reaching their highest and lowest prices.
See other stocks reaching their highest and lowest prices.
FNMFO stock is 10.00% volatile and has beta coefficient of 0.22. Track Fannie Mae stock price on the chart and check out the list of the most volatile stocks — is Fannie Mae there?
Today Fannie Mae has the market capitalization of 12.52 B, it has increased by 26.73% over the last week.
Yes, you can track Fannie Mae financials in yearly and quarterly reports right on TradingView.
Fannie Mae is going to release the next earnings report on Feb 12, 2026. Keep track of upcoming events with our Earnings Calendar.
FNMFO earnings for the last quarter are 0.65 USD per share, whereas the estimation was 0.68 USD resulting in a −3.97% surprise. The estimated earnings for the next quarter are 0.65 USD per share. See more details about Fannie Mae earnings.
Fannie Mae revenue for the last quarter amounts to 7.31 B USD, despite the estimated figure of 7.70 B USD. In the next quarter, revenue is expected to reach 7.39 B USD.
FNMFO net income for the last quarter is 3.86 B USD, while the quarter before that showed 3.32 B USD of net income which accounts for 16.34% change. Track more Fannie Mae financial stats to get the full picture.
No, FNMFO doesn't pay any dividends to its shareholders. But don't worry, we've prepared a list of high-dividend stocks for you.
As of Nov 10, 2025, the company has 8.2 K employees. See our rating of the largest employees — is Fannie Mae on this list?
EBITDA measures a company's operating performance, its growth signifies an improvement in the efficiency of a company. Fannie Mae EBITDA is 148.74 B USD, and current EBITDA margin is 94.37%. See more stats in Fannie Mae financial statements.
Like other stocks, FNMFO shares are traded on stock exchanges, e.g. Nasdaq, Nyse, Euronext, and the easiest way to buy them is through an online stock broker. To do this, you need to open an account and follow a broker's procedures, then start trading. You can trade Fannie Mae stock right from TradingView charts — choose your broker and connect to your account.
Investing in stocks requires a comprehensive research: you should carefully study all the available data, e.g. company's financials, related news, and its technical analysis. So Fannie Mae technincal analysis shows the buy rating today, and its 1 week rating is buy. Since market conditions are prone to changes, it's worth looking a bit further into the future — according to the 1 month rating Fannie Mae stock shows the buy signal. See more of Fannie Mae technicals for a more comprehensive analysis.
If you're still not sure, try looking for inspiration in our curated watchlists.
If you're still not sure, try looking for inspiration in our curated watchlists.