GRSXY trade ideas

GRASIMAfter reversing from a Bullish AB=CD it formed a Cup and Handle pattern which is indicating continuation of rally towards 1550/1625 & 1700 which also happens to be a trendline monthly resistance as long as it sustains above 1420. Breakout gets stronger on hourly close above 1490 else one can use dips if any till 1450-1435 for an entry.
Cup & Handle Patterns are bullish continuation patterns found in uptrends (Source: Investopedia)
A cup and handle price pattern on a security's price chart is a technical indicator that resembles a cup with a handle, where the cup is in the shape of a "u" and the handle has a slight downward drift. The cup and handle is considered a bullish signal, with the right-hand side of the pattern typically experiencing lower trading volume. The pattern's formation may be as short as seven weeks or as long as 65 weeks.


Grasim Ready to Breaout BUY @ 1490 Grasim Ready to Breaout BUY @ 1490 hold the swing till the rally continues..!


Grasim industries ready to breakoutGrasim industries good to enter now for a target of 1600.
Stoploss according to your own risk-reward ratio.
****For educational purpose


GRASIM IS NOW NEAR TO RESISTANCEGRASIM IS NOW NEAR RESISTANCE LEVEL MOSTLY CHANCE TO BREAK UP SIDE ITS ON READY FOR THIRD TIME BREAK ONCE IT BREAKS LEVEL WE WILL GOOD MOVE FOR UPSIDE ,ITS ONLY FOR EDUCATION PURPOSE ONLY.

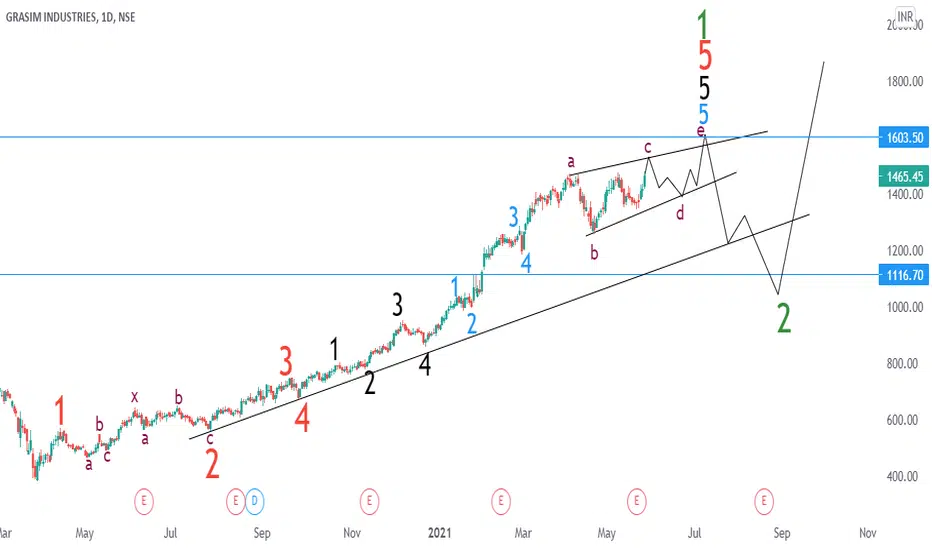
Grasim wave analysis5th wave extenstion is ending soon.Huge crash coming in grasim industries within july towards 1100


Enter after the breakout - GRASIMIf the result is positive, It will complete its retesting and the rally will start.

Grasim Bullish If price move above 1360 and if price rallies with volume, go long. ATH price rejected, Good earnings report, new area of business and excellent valuation. Good to hold until 1670.
Right-angled triangle, breakout expected at 1460, either gap up or bullish candles with high volume is expected. If price rejects below 1440 levels, exit the trade by booking profits.
SL- 1318 (only for cash long), exit at 1350 if holding for long


GRASIM INDUSTRIESFor LONG TERM BUY ABOVE 1467 WHEN DAY CANDLE CLOSE ABOVE IT
TARGET 1575
DURATION MAXIMUM 30 DAYS


GRASIM Target - 1800 With cement boom happening and technical analysis (ADX, crossover on daily, momentum and volume indicating positive sentiment) showing bounce from kumo clouds, we can be assured that GRASIM will have reach 2000 Rs easily in the next 3-6 months. Great price to buy now and swing trade later!

