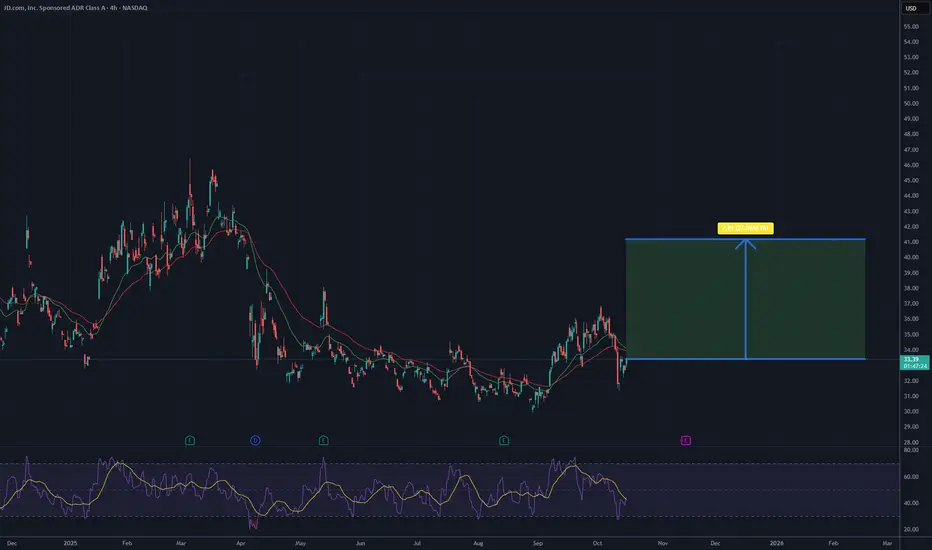
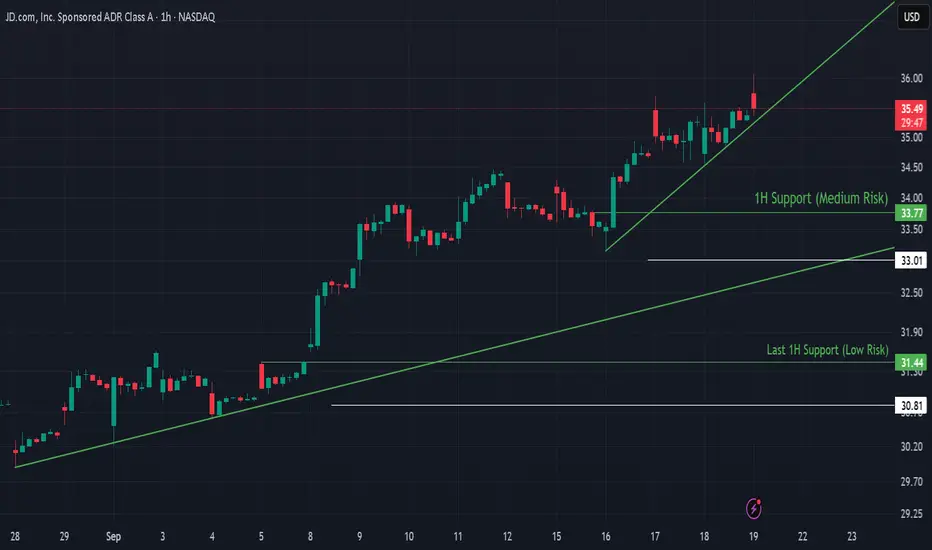
It's a time for JD - 20 % potential profitAs of October 15, 2025,the price of JD.com shares stands at approximately 33.36 USD, with a slight increase of 4.74% over the last 24 hours, though it has declined by 8.06% in the past week and 17.50% over the year. The chart indicates a downward trend from a peak of 50 USD in March 2025, but the pr
Next report date
—
Report period
—
EPS estimate
—
Revenue estimate
—
1.84 USD
5.77 B USD
161.68 B USD
2.68 B
About JD.com, Inc. Sponsored ADR Class A
Sector
Industry
CEO
Ran Xu
Website
Headquarters
Beijing
Founded
1998
ISIN
KYG8208B1014
FIGI
BBG00W5FF4L2
JD.com, Inc. is a technology-driven E-commerce company, which engages in the sale of electronics products and general merchandise products, including audio, video products, and books. It operates in the following segments: JD Retail, JD Logistics, and New Businesses. The JD Retail segment offers online retail, online marketplace, and marketing services. The JD Logistics segment includes internal and external logistics businesses. The New Businesses segment is composed of JD Property, Jingxi, overseas businesses and technology initiatives. The company was founded on June 18, 1998, by Qiang Dong Liu and is headquartered in Beijing, China.
Related stocks
JD: Looking for an up move/wave.From a technical point of view and based on WTW Concept, JD looks like it will go up after the completion of the needed structure.
We Trade Waves
WTW Team
Disclosure: We are part of Trade Nation's Influencer program and receive a monthly fee for using their TradingView charts in our analysis.
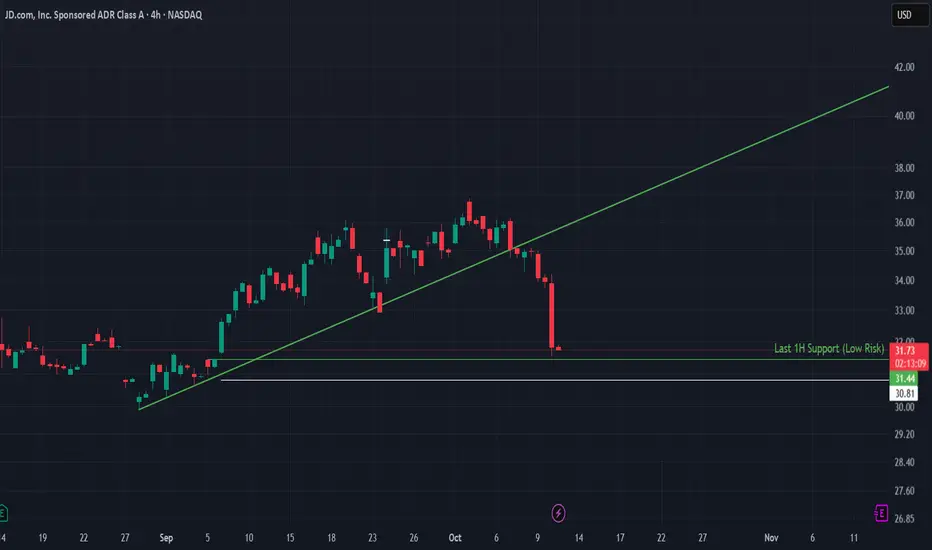
JD.com – Tariff Shock Meets Trendline BreakJD.com fell sharply after Donald Trump’s renewed tariff comments reignited fears of a potential U.S.–China trade war, putting Chinese equities under pressure.
From a technical standpoint, JD has broken below its short-term uptrend, which had been supporting the bullish move since early September. T
$JD Bullish Cypherpotential upside of 40%ish at $44.56/share as the first target if stock price reverses from this bullish cypher pattern.

JD at good long term supportwith good financials and AI demand in future I think JD good investment for long term 1-3 years
sitting currently on long term support
Buy Zone between 20-30
I am not financial advisor
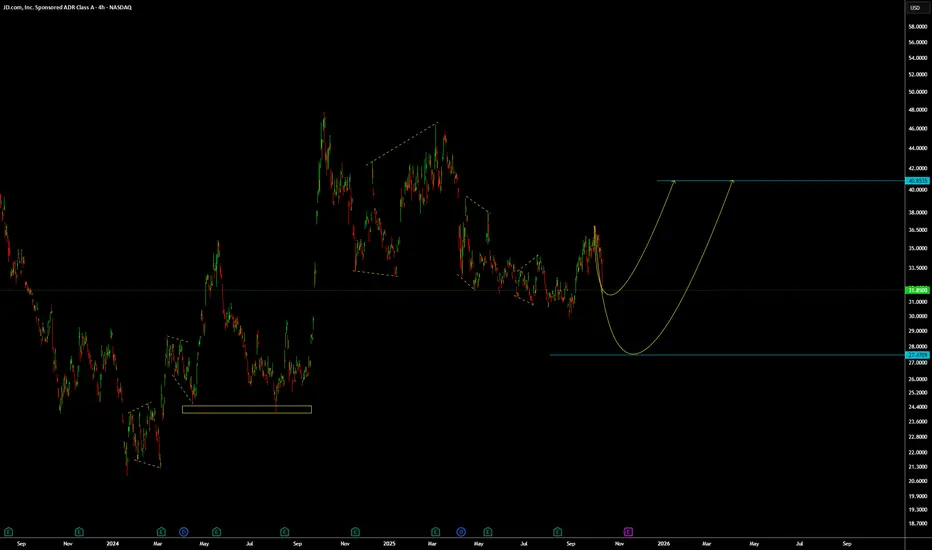
JD.com Building an Uptrend After Tariff-Driven DropJD.com (JD) has been recovering strongly after a sharp decline to $29.90 triggered by tariff war concerns. The stock is now building an uptrend, showing momentum with higher lows and stacked support levels.
🔍 Technical Analysis
Current Price: $35.65
Recent recovery followed a steep sell-off botto
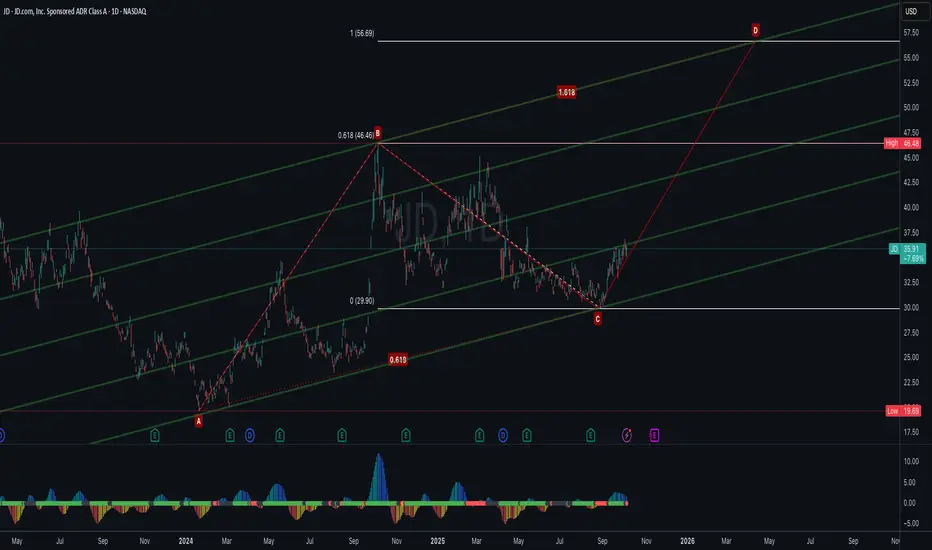
JD.com Bullish ABCD Harmonic Pattern SetupJD.com (JD) is forming a bullish ABCD harmonic pattern, with the current price advancing from point C toward the projected D completion zone. Based on the Fibonacci measurements, the AB=CD projection and 1.618 extension align near $56–57, suggesting a strong potential target area and confluence with
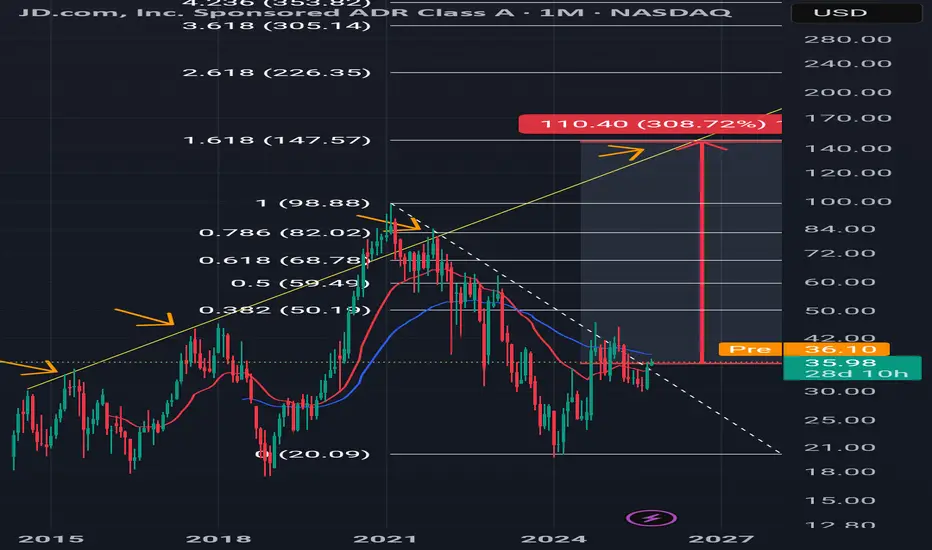
$JDInteresting oberservation, all the previous rallies on fib fall exactly at 1.61 or 2.61 before retracing back to the lows. If we map in the similar trend on the current chart that comes exactly as 1.61 around 140/145 range which is a 3X from here and also comes in direct contact of the past trend li
Here are my thoughts on $JDNASDAQ:JD looks to have put in a strong bottom near the yellow channel low. 3 Doji Candles in row for the last 3 weeks... + RSI momentum shift + MACD bullish cross + volume increasing..... all point to potential swing toward the pivot point ($40–42) and potentially the channel top ($48–49) if bulls
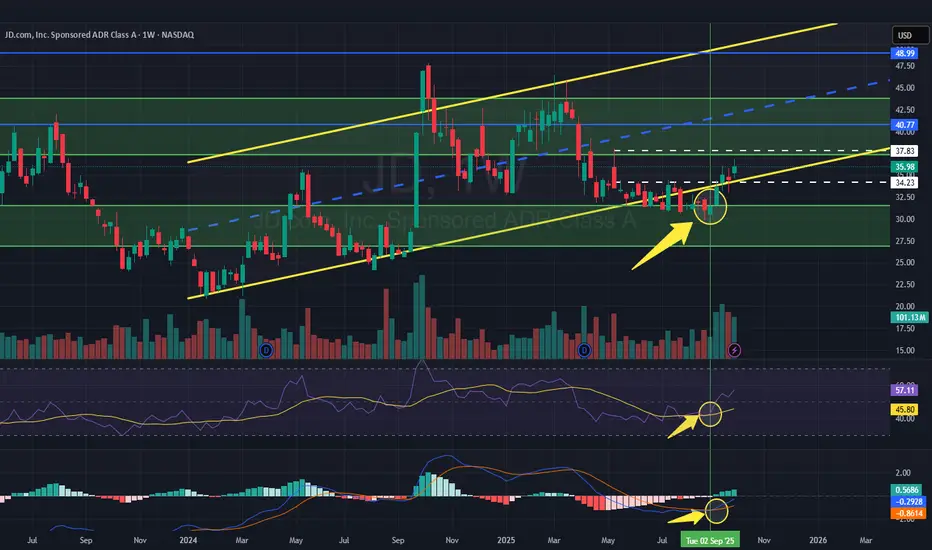
JD 1D: Bulls taking the lead?On the daily chart, JD.com broke out of a falling wedge, moving above both MA50 and MA200. That’s a strong technical signal hinting at a potential mid-term trend reversal.
Upside targets are mapped at $39.8 and $46, with Fibonacci levels suggesting a possible extension toward $52 if momentum hold

See all ideas
Summarizing what the indicators are suggesting.
Neutral
SellBuy
Strong sellStrong buy
Strong sellSellNeutralBuyStrong buy
Neutral
SellBuy
Strong sellStrong buy
Strong sellSellNeutralBuyStrong buy
Neutral
SellBuy
Strong sellStrong buy
Strong sellSellNeutralBuyStrong buy
An aggregate view of professional's ratings.
Neutral
SellBuy
Strong sellStrong buy
Strong sellSellNeutralBuyStrong buy
Neutral
SellBuy
Strong sellStrong buy
Strong sellSellNeutralBuyStrong buy
Neutral
SellBuy
Strong sellStrong buy
Strong sellSellNeutralBuyStrong buy
Displays a symbol's price movements over previous years to identify recurring trends.
Curated watchlists where JDCMF is featured.

Frequently Asked Questions
The current price of JDCMF is 15.78 USD — it has decreased by −9.66% in the past 24 hours. Watch JD.com, Inc. stock price performance more closely on the chart.
Depending on the exchange, the stock ticker may vary. For instance, on OTC exchange JD.com, Inc. stocks are traded under the ticker JDCMF.
JDCMF stock has fallen by −7.47% compared to the previous week, the month change is a −0.74% fall, over the last year JD.com, Inc. has showed a −20.36% decrease.
We've gathered analysts' opinions on JD.com, Inc. future price: according to them, JDCMF price has a max estimate of 29.99 USD and a min estimate of 15.19 USD. Watch JDCMF chart and read a more detailed JD.com, Inc. stock forecast: see what analysts think of JD.com, Inc. and suggest that you do with its stocks.
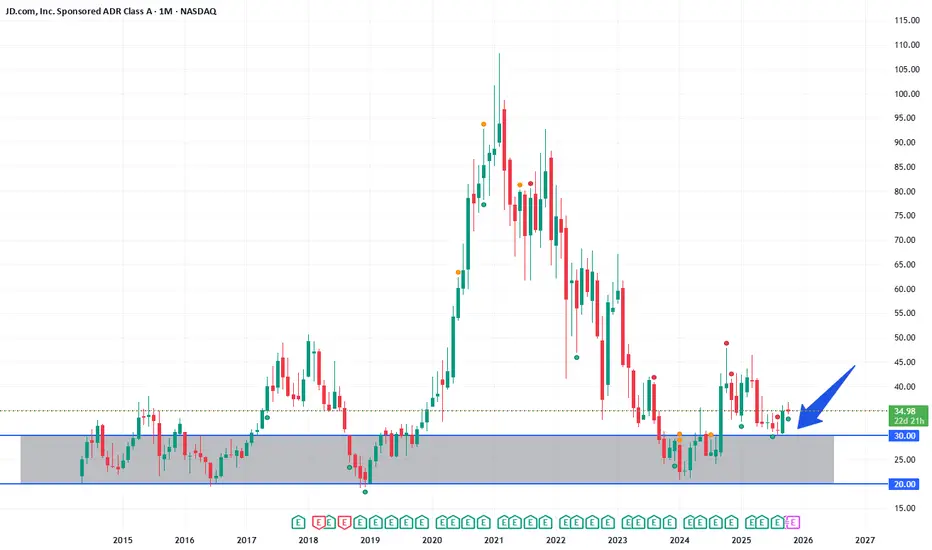
JDCMF reached its all-time high on Feb 16, 2021 with the price of 51.58 USD, and its all-time low was 10.26 USD and was reached on Mar 5, 2024. View more price dynamics on JDCMF chart.
See other stocks reaching their highest and lowest prices.
See other stocks reaching their highest and lowest prices.
JDCMF stock is 10.69% volatile and has beta coefficient of 0.60. Track JD.com, Inc. stock price on the chart and check out the list of the most volatile stocks — is JD.com, Inc. there?
Today JD.com, Inc. has the market capitalization of 48.22 B, it has decreased by −4.86% over the last week.
Yes, you can track JD.com, Inc. financials in yearly and quarterly reports right on TradingView.
JD.com, Inc. is going to release the next earnings report on Nov 13, 2025. Keep track of upcoming events with our Earnings Calendar.
JDCMF earnings for the last quarter are 0.35 USD per share, whereas the estimation was 0.26 USD resulting in a 34.95% surprise. The estimated earnings for the next quarter are 0.18 USD per share. See more details about JD.com, Inc. earnings.
JD.com, Inc. revenue for the last quarter amounts to 49.60 B USD, despite the estimated figure of 46.61 B USD. In the next quarter, revenue is expected to reach 41.32 B USD.
JDCMF net income for the last quarter is 848.98 M USD, while the quarter before that showed 1.50 B USD of net income which accounts for −43.25% change. Track more JD.com, Inc. financial stats to get the full picture.
Yes, JDCMF dividends are paid annually. The last dividend per share was 0.50 USD. As of today, Dividend Yield (TTM)% is 3.13%. Tracking JD.com, Inc. dividends might help you take more informed decisions.
JD.com, Inc. dividend yield was 2.86% in 2024, and payout ratio reached 26.65%. The year before the numbers were 2.64% and 35.32% correspondingly. See high-dividend stocks and find more opportunities for your portfolio.
As of Oct 21, 2025, the company has 570.89 K employees. See our rating of the largest employees — is JD.com, Inc. on this list?
EBITDA measures a company's operating performance, its growth signifies an improvement in the efficiency of a company. JD.com, Inc. EBITDA is 5.47 B USD, and current EBITDA margin is 4.14%. See more stats in JD.com, Inc. financial statements.
Like other stocks, JDCMF shares are traded on stock exchanges, e.g. Nasdaq, Nyse, Euronext, and the easiest way to buy them is through an online stock broker. To do this, you need to open an account and follow a broker's procedures, then start trading. You can trade JD.com, Inc. stock right from TradingView charts — choose your broker and connect to your account.
Investing in stocks requires a comprehensive research: you should carefully study all the available data, e.g. company's financials, related news, and its technical analysis. So JD.com, Inc. technincal analysis shows the strong sell today, and its 1 week rating is strong sell. Since market conditions are prone to changes, it's worth looking a bit further into the future — according to the 1 month rating JD.com, Inc. stock shows the sell signal. See more of JD.com, Inc. technicals for a more comprehensive analysis.
If you're still not sure, try looking for inspiration in our curated watchlists.
If you're still not sure, try looking for inspiration in our curated watchlists.