KIO 30min Long Idea rising TriangleKIO 30min chart has formed a nice rising wedge pattern which will confirm a long entry if we close above R445
Entry : Close above R445
stop : 434
target :462
KUMBF trade ideas

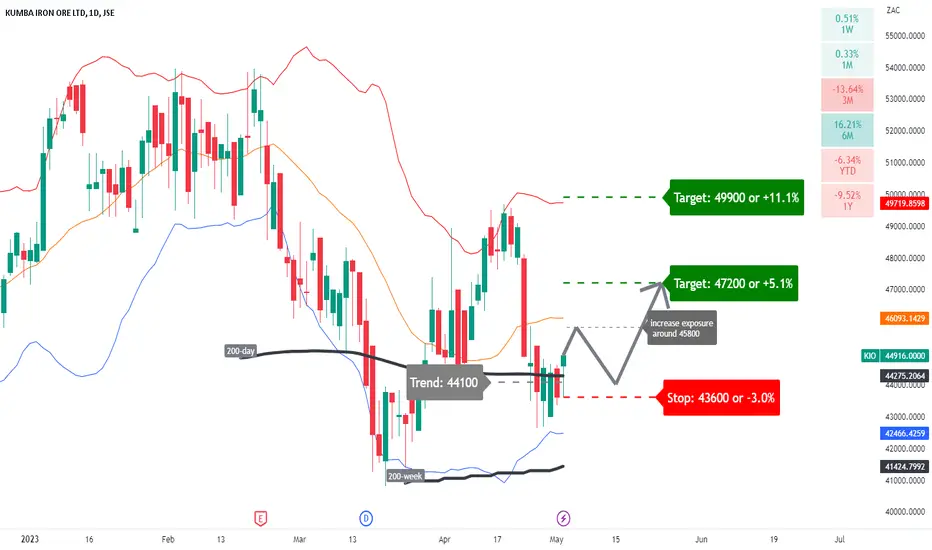
KIO: building on higher lows?A price action above 44100 supports a bullish trend direction.
Crossed just above its 200-day simple moving average.
Confirmation for further upside potential for a break above 45800.
The first target price is set at 47200.
The second target price is set at 49900.
The stop-loss is at 43600 and will negate the bullish bias.
Remains a risky trade.
KIO: some further upside potential?A price action above 48000 supports a bullish trend direction.
Increase long exposure for a break above 51300.
Upside price potential at 54300.
Downside price potential at 46300. Negate the bullish stance for a break below this level.
Remains above its 200-day simple moving average.
The price action might attempt leg 3 of the megaphone pattern.

KIO - Consolidation breakoutWith the past two days' price action, JSE:KIO has broken out of the bottom of a sideways consolidation that it has been trading in since early Jan. If all goes according to plan, we can expect a move all the way to the support level at the 417 area.

KUMBA- Lower highsAs shown on the daily chart, KIO has steadily been making lower highs from the boom period of 2021. This chart does not bode well for the price with their earnings due on 21 Feb. Momentum indicators are looking lackluster to say the least and from a fundamental point of view, I think supply chain issues and Eskom has hampered production and delivery. I have a sneaky suspicion that earnings are going to disappoint. I expect a gradual fade well into April and would not be surprised if the stock went all the way down to test that support level of around R350.00. looks like a good short to me...

Kumba Iron OreIf 470/480 can hold as support we may get a bounce back to 550; which area need to give in to expose 640 as next possible target!

Kumba Iron Ore Cup and now Box formation target R686.33Cup and Handle previously formed on KIO.
It then moved into a sideways pattern, making a rectangle (Box).
Now we need the price to break out of it, before a decent trade lines up.
7=21>200 - Bullish
RSI>50 - Bullish
Target R686.33

Kumba Iron Ore new Cup and Handle showing major upside to R686.3Cup and Handle has formed aver the last year.
Price broke above the brim level but then moved sideways. During the time it was making higher lows which is bullish by nature, but we haven't had the push we need.
Hence, the price is retesting the Brim which is forming a conservative entry for breakout traders.
7>21>200 - Bullish
RSI>50 - Bullish
Target R686.33

#KIO Kumba approaching huge weekly support level #JSER360.00 is clear support here... as highlighted in yellow circles, march saw similar action where the stock consolidated just under the 200wma before igniting a rally of some proportion. Are we going to see something similar here?

Target 1 hit for KIO at R514.02 here's the next setup PRICE Target 1 hit at R514.02 for Kumba Iron Ore.
And immediately have a new formation form with a new Cup and Handle
The second target 2 is R636.71
7>21 7 crossing 200MA
Bullish bias
Let's goo!

KIO - Bull flag breakoutKIO is breaking out of a bull flag which should target around R500 as a minimum. Longer time frame (possibly weeks) there is overhead minor overhead resistance around R550 and thereafter yellow TL (resistance) should come into play at which point I would expect a pullback.

KUMBA - Short IDEAKumba reached its 200dma and has clear resistance at these levels... (61.8 retrace)
Looking for a pullback towards the R425 level initially.
Stoploss is a daily close above R502

KUMBA IRON ORE (KIO)Kumba Iron Ore is has completed a Double Bottom pattern in a bullish momentum.
Confirmed breakout above the 427 resistance.
Target 1 @ 476
Target 2 @ 492
Target 3 @ 537

Kumba Iron OreStill some way to go before Kumba can re-establish its uptrend.
First level that buyers need to overcome is the 430 level which is coinciding with the 100dma.

KIOA slide from this morning's research note:
Kumba Iron Ore (KIO) | On Wednesday, the data suggested an ultra short term overbought rating, with a subsequent unwind to close the
session -4.40%. The 8-EMA has crossed above the 21-EMA (both of which are starting to rise). The share could re-test the 8 21-EMA range or
slightly below it at the prior breakout level at ~38200c to ~39000c.
For more research, including trade ideas, get in touch today.

Kumba below the support levelWe recently shared a chart of JSE:KIO , then KIO was at the support level. JSE:KIO is currently below the support level, and there's above average selling volume. The stock might go lower.

Kumba Iron Ore-TP target exceeded!Kumba hit the 370/380 TP target earlier this week; reaching lows below in 366 yesterday's session.
*Original idea below!

KIO - Short Idea Now 35% In The MoneyI'd should have bigger targets, right? That short from R600-R610 is now 35% in the money. Original idea attached.

Kumba JSE:KIO is at an area of value. The level provided support in Nov '21, will history repeat itself? One can always hope that the support will help, until it doesn't. Dividend came in for investors yesterday (EasyEquities platform).
No position.

Kumba fireThe dividend darling seems to be completing a wave 4 of (3) with a running flat. I anticipate a rally to around the 80000c region.

Kumba Iron OreHead & Shoulder pattern developing on the daily chart, whose neckline is also acting as trendline support.
Should it give in, it may take us to 370/380.

KIO: further downside potential?A bearish trend is applicable below 53700. Crossing above this level will negate the negative stance.
The level 51300 acts as further bearish trend support.
Consolidation around 48900 to 52100. Crossing below 48900 will target 45700.
A break above 52100 will be the first sign of strength in the share.
Remains a risky trade.

Kumba - short We have entered a short on JSE:KIO based off of the stochastic, MACD and EMAs all pointing downwards. Aiming for the 377 level for our target.
