KUMBF trade ideas
$JSEKIOJSE:KIO
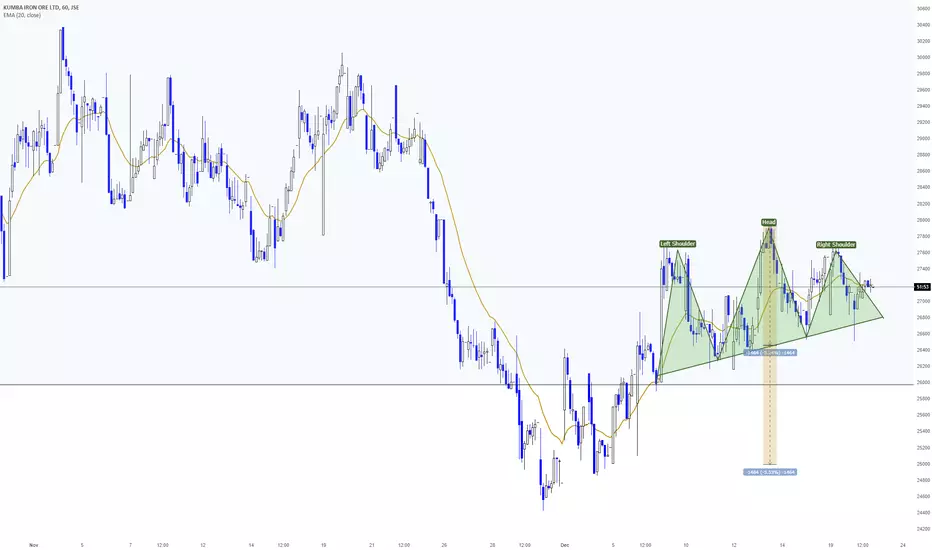
Hourly chart making head and shoulders. If neckline is taken will probably test recent lows.
This is more for short term traders.
$JSEKIOJSE:KIO
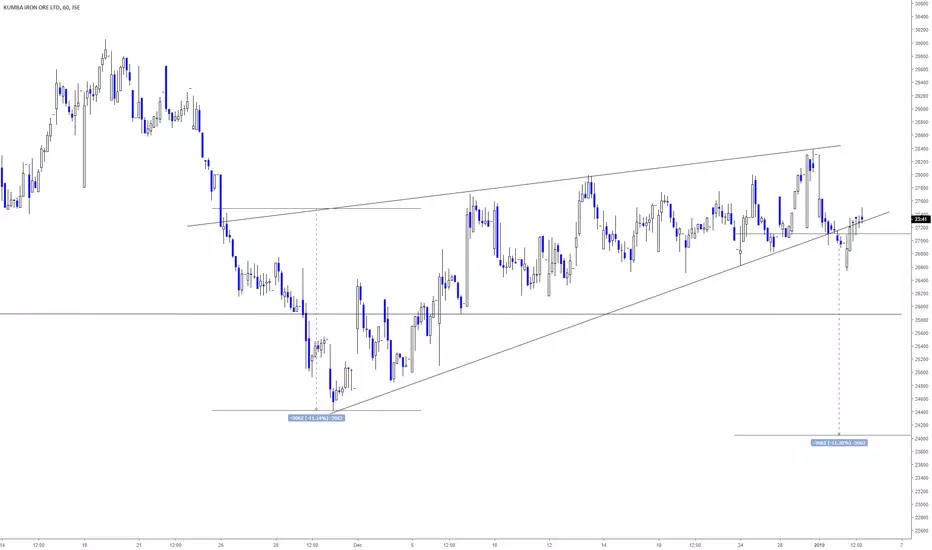
Broke bellow big consolidation area, backtest yesterday and today and looks like now continuation towards target around 19500/20000 area

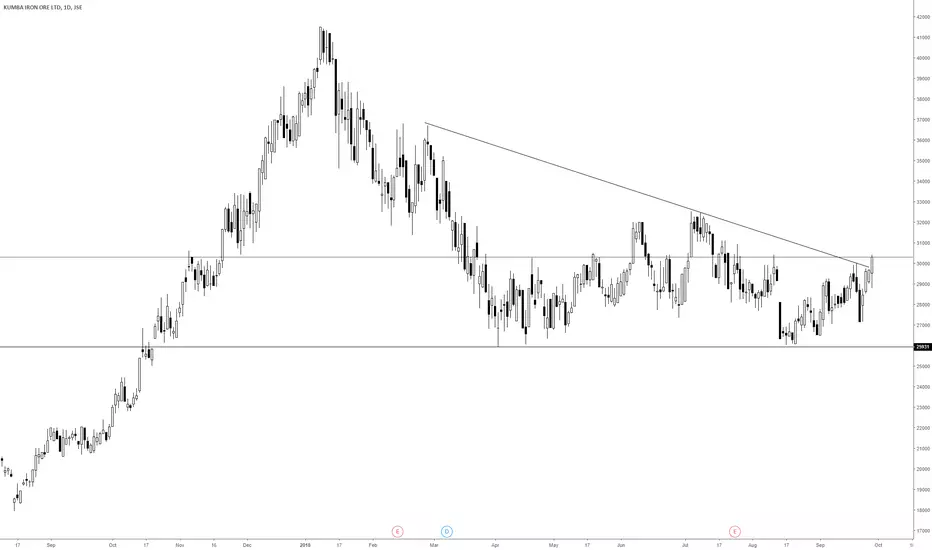
$JSEKIO Breaking down from the channelKumba Iron Ore Has been trading within the bounds of this channel for the most part of 2018. A daily close below the R260.00 support level, could see us move to a projected target of R198-R200. One would suspect many stale bulls holding above R260 and this break could see similar action as we saw on $JSEAPN Aspen when it broken down from its longer term channel base @ R240.00

%JSEKIOJSE:KIO
Didn't manage to break higher,pulled back towards mid of the range. Making small bearish flag currently. Will probably go and test bottom of the range.

KUMBA IRON SHORTKumba's horizontal resistance coincides very closely with the 200 day moving average. Having broken below this moving average, it signals a sell on the stock. We are currently seeing a bounce to re-test that level as well as resistance...I'll be looking to short R314.00 for a downside target of R270.00. Risking only 2% of my portfolio, the stop loss is placed at R327.00 which could signal a possible breakout

$JSEKIOJSE:KIO
It made flat bottom triangle similar one that we had in MTN and APN recently.
If you are bearish on it yesterday's candle is very bearish. Aggressive short with stop loss above yesterday's HOD.

Kumba trading back up in the channelWith Asia trading higher this morning, KIO is holding up okayish but we could very well see the stock trade higher to close that "dividend gap". I also think there is a good probability that the price could make an attempt at the upper band of the more medium term sideways channel. I almost want to say the next "dip" can be bought...
