LBRDA: Fundamental Analysis +41%With 2024 revenue of $ 1.02 billion, Liberty Broadband Corporation is an american communications company. EverStock identifies a fundamental revaluation potential of +41 %.
Valuation at 10.06 x net earnings :
Currently valued at $ 8.74 billions in market capitalization, Liberty Boardband Corporatio
7.58 USD
869.00 M USD
1.02 B USD
334.02 K
About Liberty Broadband Corporation
Sector
Industry
CEO
Martin Edward Patterson
Website
Headquarters
Englewood
Founded
1991
ISIN
US5303072061
FIGI
BBG006GNS9Z0
Liberty Broadband Corp. operates as a holding company, which engages in the cable, broadband, and mobile location technology businesses. It operates through the following segments: GCI Holdings, Charter, and Corporate and Other. The GCI Holdings segment provides data, wireless, video, voice, and managed services to residential, businesses, governmental entities, and educational and medical institutions primarily in Alaska. The Charter segment provides cable services in the United States, offering entertainment, information, and communications solutions to residential and commercial customers. The company was founded on March 28, 1991 and is headquartered in Englewood, CO.
Related stocks

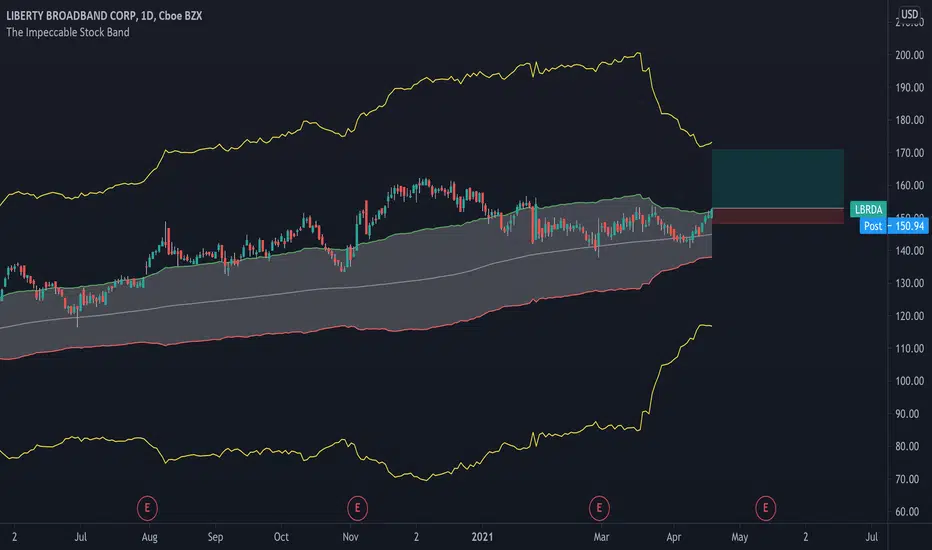
New Setup: LBRDALBRDA: I have a swing trade setup. I'm looking to enter long if the stock can manage to CLOSE above the last candle highs. If triggered, I will then place a stop-loss below (SL) and a price target above it(TP-50%,move SL to breakeven), then using the close below the 10SMA as a trailing stop loss.
**

Analyzing Liberty Broadband's Performance and Market Outlook:Liberty Broadband (NASDAQ: NASDAQ:LBRDA ) recently announced its quarterly sales figures, aligning closely with analyst expectations. This announcement, coupled with observed positive price momentum, has sparked interest among investors. However, a deeper analysis is necessary to gauge the company's

LBRDA: Breakout Confirmed, 11.63% Potential Profit!Description: LBRDA is trending higher and in an uptrend meaning that highs are getting higher and lows are getting higher. The uptrend line on the chart and the Trending Band Indicator (which measures trend) supports the Long Position.
Stats:
1. Ideal buy range: $151.2 - $155.7
2. Take profit: $169
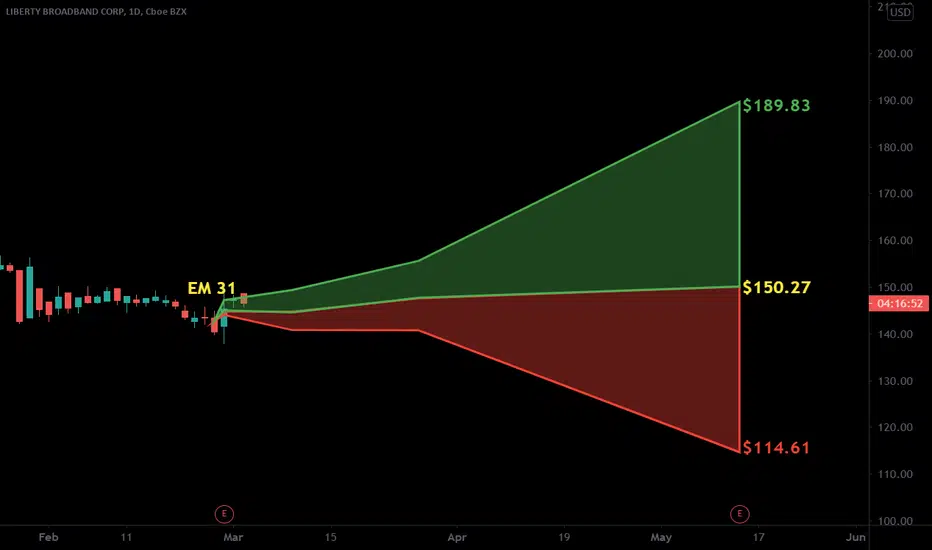
$LBRDA with a neutral outlook following its earnings #Stocks The PEAD projected a Neutral outlook for $LBRDA after a positive over reaction following its earnings release placing the stock in drift A
If you would like to see the Drift for another stock please message us. Also click on the Like Button if this was useful and follow us or join us.
BIG Potential for LIBERTY BROABRAND CORP DailyHey traders, LIBERTY BROABRAND CORP is in a very important moment in its history we can witness a new historical high. It's in a fake bearish movement with a big sell volume and a hammer bear candle. The TIMEFRAME 5 1 min we see a bullish continuation all the conditions are met for rise. It is quite


LBRDK- Bullish Until $100+ ishTime to jump on Long/Bull Train with this stock. Current $88 to around $102 (resistance) would be great run for next 3-5 weeks. You could just buy stocks or write covered calls at $100 (if available) collect premium/credit and profit as stock goes up. Do your own homework always, but I trust charts


See all ideas
Summarizing what the indicators are suggesting.
Oscillators
Neutral
SellBuy
Strong sellStrong buy
Strong sellSellNeutralBuyStrong buy
Oscillators
Neutral
SellBuy
Strong sellStrong buy
Strong sellSellNeutralBuyStrong buy
Summary
Neutral
SellBuy
Strong sellStrong buy
Strong sellSellNeutralBuyStrong buy
Summary
Neutral
SellBuy
Strong sellStrong buy
Strong sellSellNeutralBuyStrong buy
Summary
Neutral
SellBuy
Strong sellStrong buy
Strong sellSellNeutralBuyStrong buy
Moving Averages
Neutral
SellBuy
Strong sellStrong buy
Strong sellSellNeutralBuyStrong buy
Moving Averages
Neutral
SellBuy
Strong sellStrong buy
Strong sellSellNeutralBuyStrong buy
Displays a symbol's price movements over previous years to identify recurring trends.
Curated watchlists where LBRDB is featured.

Frequently Asked Questions
The current price of LBRDB is 54.00 USD — it has decreased by −2.24% in the past 24 hours. Watch Liberty Broadband Corporation stock price performance more closely on the chart.
Depending on the exchange, the stock ticker may vary. For instance, on OTC exchange Liberty Broadband Corporation stocks are traded under the ticker LBRDB.
LBRDB stock has fallen by −22.44% compared to the previous week, the month change is a −22.44% fall, over the last year Liberty Broadband Corporation has showed a −32.50% decrease.
LBRDB reached its all-time high on Aug 13, 2021 with the price of 178.00 USD, and its all-time low was 41.00 USD and was reached on Feb 10, 2016. View more price dynamics on LBRDB chart.
See other stocks reaching their highest and lowest prices.
See other stocks reaching their highest and lowest prices.
LBRDB stock is 2.30% volatile and has beta coefficient of 1.22. Track Liberty Broadband Corporation stock price on the chart and check out the list of the most volatile stocks — is Liberty Broadband Corporation there?
Today Liberty Broadband Corporation has the market capitalization of 7.75 B, it has decreased by −4.63% over the last week.
Yes, you can track Liberty Broadband Corporation financials in yearly and quarterly reports right on TradingView.
LBRDB net income for the last quarter is −154.00 M USD, while the quarter before that showed 383.00 M USD of net income which accounts for −140.21% change. Track more Liberty Broadband Corporation financial stats to get the full picture.
No, LBRDB doesn't pay any dividends to its shareholders. But don't worry, we've prepared a list of high-dividend stocks for you.
As of Nov 7, 2025, the company has 1.9 K employees. See our rating of the largest employees — is Liberty Broadband Corporation on this list?
EBITDA measures a company's operating performance, its growth signifies an improvement in the efficiency of a company. Liberty Broadband Corporation EBITDA is 244.00 M USD, and current EBITDA margin is 29.43%. See more stats in Liberty Broadband Corporation financial statements.
Like other stocks, LBRDB shares are traded on stock exchanges, e.g. Nasdaq, Nyse, Euronext, and the easiest way to buy them is through an online stock broker. To do this, you need to open an account and follow a broker's procedures, then start trading. You can trade Liberty Broadband Corporation stock right from TradingView charts — choose your broker and connect to your account.
Investing in stocks requires a comprehensive research: you should carefully study all the available data, e.g. company's financials, related news, and its technical analysis. So Liberty Broadband Corporation technincal analysis shows the sell today, and its 1 week rating is strong sell. Since market conditions are prone to changes, it's worth looking a bit further into the future — according to the 1 month rating Liberty Broadband Corporation stock shows the strong sell signal. See more of Liberty Broadband Corporation technicals for a more comprehensive analysis.
If you're still not sure, try looking for inspiration in our curated watchlists.
If you're still not sure, try looking for inspiration in our curated watchlists.