Rising triangle in anticipation of accelerated approval of FDAPharming has received acceptance from both the EMA and FDA for the accelerated review of leniolisib. The new drug is anticipated to generate significantly more revenue compared to its current profitable drug Ruconest. While the company has been profitable for the past years, it needed to find new so
Next report date
—
Report period
—
EPS estimate
—
Revenue estimate
—
−0.01 USD
−11.33 M USD
284.43 M USD
669.58 M
About Pharming Group NV
Sector
Industry
CEO
Fabrice Chouraqui
Website
Headquarters
Leiden
Founded
1988
ISIN
NL0010391025
FIGI
BBG000G4B509
Pharming Group NV is a holding company, which engages in the development of pharmaceutical products for the treatment of rare diseases and unmet medical needs. The firm offers RUCONEST, which is a recombinant human C1-esterase inhibitor for the treatment of acute hereditary angioedema. It operates through the following segments: RUCONEST®, Joenja®, Europe, and Rest of the World. The company was founded on November 11, 1988, and is headquartered in Leiden, the Netherlands.
Related stocks

Fading into PHARM negative trend.Pharming Group - 30d expiry- We look to Sell a break of 0.934 (stop at 0.993)
Short term bias has turned negative.
Daily signals are mildly bearish.
A higher correction is expected.
We are trading at overbought extremes.
0.936 has been pivotal.
A break of 0.936 is needed to confirm follow thr

Pharm looks weakAfter visiting the support for the 3rd time it only had a short and weak rally up. I think we will visit the 50 cents soon. This could be a good oppertunity to buy in. DCA from 60 cents towards the 0.618 , or 38 cents....the golden pocket

PHARMING LONG after touched 200EMAPharming is a company with good fundamentals and now also available on the NASDAQ via a ADR (10 stocks). Take a look to the company.
Technical Analyse:
After it touched the 200 EMA you can see the big push to the North. My expectation is that this stock will go further North up, probably at least


PHARM ; Possible bullish pullbackIf it stays above the support today, a buy signal will occur for Monday.

Pharming in a channel Pharming seems to be in a channel with upgoing support.
It will go for its 3rd resistance try.

PHARMING LONG termHello all,
Here another TA of me, this time on the stock PHARMING.
Its a very interesting company, i would advice you to dive in the fundamentals for further information. I will just show the possibilities with TA.
Before you choose to buy and hold a stock, always do your homework on the fundament

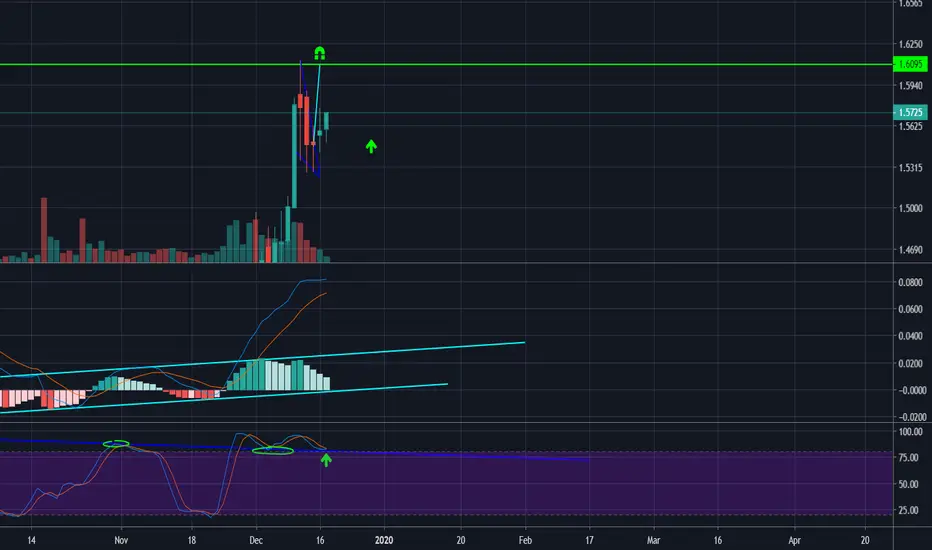
Pharming Group possible break of major resistance at 1.61Pharming group holdings has been hold back twice in history at around 1.6, i have been watching the MAC D and Stochastic indicator on the daily, they both show interesting signals such as on the macd: Descending red with ascending green, this would at least tell me a new attempt of breaking 1.61 is
Looks like something is brewingHalf year results coming up for pharming and seems to be breaking out of the triangle to the upside. First target 1 EUR.
- MACD crossover to bullish side
- RSI crawling up from lower

See all ideas
Summarizing what the indicators are suggesting.
Neutral
SellBuy
Strong sellStrong buy
Strong sellSellNeutralBuyStrong buy
Neutral
SellBuy
Strong sellStrong buy
Strong sellSellNeutralBuyStrong buy
Neutral
SellBuy
Strong sellStrong buy
Strong sellSellNeutralBuyStrong buy
An aggregate view of professional's ratings.
Neutral
SellBuy
Strong sellStrong buy
Strong sellSellNeutralBuyStrong buy
Neutral
SellBuy
Strong sellStrong buy
Strong sellSellNeutralBuyStrong buy
Neutral
SellBuy
Strong sellStrong buy
Strong sellSellNeutralBuyStrong buy
Displays a symbol's price movements over previous years to identify recurring trends.
EMUSC.EUR
UBS (Lux) Fund Solutions SICAV - UBS MSCI EMU Small Cap UCITS ETF EUR acc- CapitalisationWeight
0.16%
Market value
1.09 M
USD
UEFD
UBS (Lux) Fund Solutions SICAV - UBS MSCI EMU Small Cap UCITS ETF EUR dis- DistributionWeight
0.16%
Market value
1.09 M
USD
Explore more ETFs
Frequently Asked Questions
The current price of PHGUF is 1.20 USD — it has decreased by −20.00% in the past 24 hours. Watch Pharming Group NV stock price performance more closely on the chart.
Depending on the exchange, the stock ticker may vary. For instance, on OTC exchange Pharming Group NV stocks are traded under the ticker PHGUF.
PHGUF stock has fallen by −20.00% compared to the previous week, the month change is a −20.00% fall, over the last year Pharming Group NV has showed a 45.88% increase.
We've gathered analysts' opinions on Pharming Group NV future price: according to them, PHGUF price has a max estimate of 4.10 USD and a min estimate of 1.61 USD. Watch PHGUF chart and read a more detailed Pharming Group NV stock forecast: see what analysts think of Pharming Group NV and suggest that you do with its stocks.
PHGUF reached its all-time high on Oct 13, 2000 with the price of 11.50 USD, and its all-time low was 0.01 USD and was reached on Oct 1, 2012. View more price dynamics on PHGUF chart.
See other stocks reaching their highest and lowest prices.
See other stocks reaching their highest and lowest prices.
PHGUF stock is 25.00% volatile and has beta coefficient of 1.25. Track Pharming Group NV stock price on the chart and check out the list of the most volatile stocks — is Pharming Group NV there?
Today Pharming Group NV has the market capitalization of 866.86 M, it has decreased by −5.22% over the last week.
Yes, you can track Pharming Group NV financials in yearly and quarterly reports right on TradingView.
Pharming Group NV is going to release the next earnings report on Mar 12, 2026. Keep track of upcoming events with our Earnings Calendar.
PHGUF earnings for the last quarter are 0.01 USD per share, whereas the estimation was 0.00 USD resulting in a 2.12 K% surprise. The estimated earnings for the next quarter are 0.00 USD per share. See more details about Pharming Group NV earnings.
Pharming Group NV revenue for the last quarter amounts to 97.30 M USD, despite the estimated figure of 98.22 M USD. In the next quarter, revenue is expected to reach 96.43 M USD.
PHGUF net income for the last quarter is 4.78 M USD, while the quarter before that showed −15.13 M USD of net income which accounts for 131.57% change. Track more Pharming Group NV financial stats to get the full picture.
No, PHGUF doesn't pay any dividends to its shareholders. But don't worry, we've prepared a list of high-dividend stocks for you.
EBITDA measures a company's operating performance, its growth signifies an improvement in the efficiency of a company. Pharming Group NV EBITDA is 34.39 M USD, and current EBITDA margin is 2.48%. See more stats in Pharming Group NV financial statements.
Like other stocks, PHGUF shares are traded on stock exchanges, e.g. Nasdaq, Nyse, Euronext, and the easiest way to buy them is through an online stock broker. To do this, you need to open an account and follow a broker's procedures, then start trading. You can trade Pharming Group NV stock right from TradingView charts — choose your broker and connect to your account.
Investing in stocks requires a comprehensive research: you should carefully study all the available data, e.g. company's financials, related news, and its technical analysis. So Pharming Group NV technincal analysis shows the buy rating today, and its 1 week rating is buy. Since market conditions are prone to changes, it's worth looking a bit further into the future — according to the 1 month rating Pharming Group NV stock shows the buy signal. See more of Pharming Group NV technicals for a more comprehensive analysis.
If you're still not sure, try looking for inspiration in our curated watchlists.
If you're still not sure, try looking for inspiration in our curated watchlists.