Bearish Price Action Continuation Technically, a falling wedge should be a bullish pattern, but with OXT every pattern is a Bearish pattern. OXT has been in a downtrend for close to 6 years and it continues to form lower highs and lower lows. OXT broke below its all time low. Price has broken and closed below the support line of the

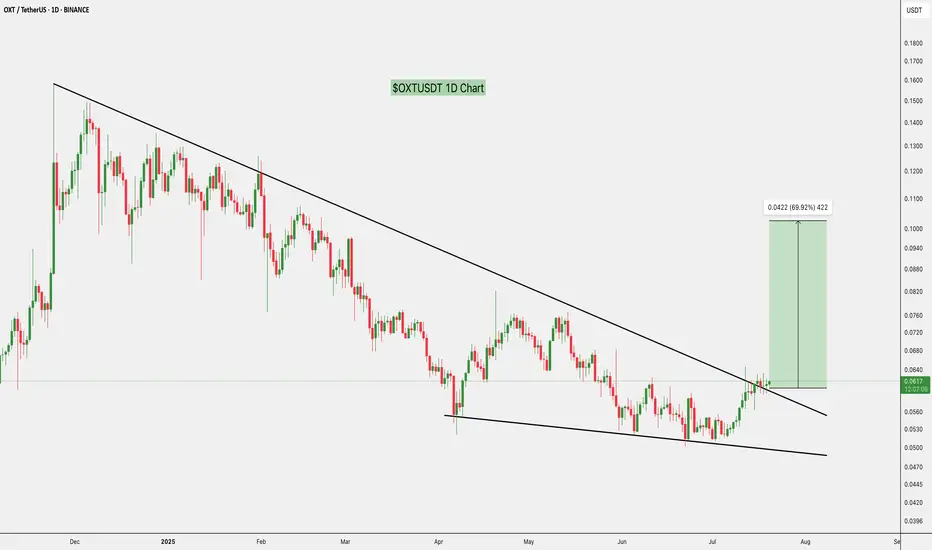
OXTUSDT 1D#OXT is moving inside a falling wedge pattern on the daily chart. Consider buying here at the current price and near the support level of:
🛡 $0.0501
In case of a breakout above the wedge resistance, the potential targets are:
🎯 $0.0629
🎯 $0.0708
🎯 $0.0773
🎯 $0.0837
🎯 $0.0928
🎯 $0.1044
⚠️ Always re

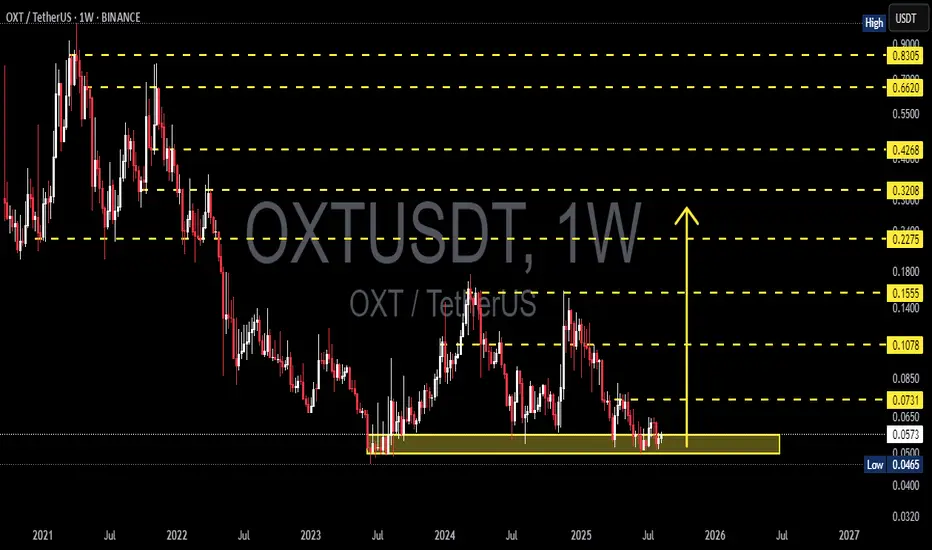
OXT/USDT — Decision Zone: Reversal or Breakdown?🔎 Overview
The OXT/USDT pair is currently sitting at a critical juncture. Since the 2021 peak, the price has been under consistent bearish pressure, forming a series of lower highs. On the other hand, from 2023 until now, OXT has repeatedly held the historical support zone at 0.0465 – 0.0600 (highl

OXT/USDT — Accumulation Before a Breakout or Further Decline?📌 Overview
OXT/USDT is currently at a critical stage on the weekly chart, consolidating within the strong demand zone at 0.0465–0.0650 (yellow box) that has been tested multiple times since mid-2023. This area acts as the last line of defense for buyers before price enters uncharted multi-year lows.
$OXT Breaks Out, 70% Rally on the TableASX:OXT has broken out of a long falling wedge, a bullish signal.
If it holds, we could see a move toward $0.105 (+70%).
Watch for a retest to confirm the breakout.
DYOR, NFA
Orchid 290% Profits Target, MA200 & Price Action FractalThe classic signals are already present on this chart, the double-bottom, etc. But I also have a price action fractal plus an unconventional signal supporting a bullish jump.
The easy target here is 290%, it can be hit within months. Not more than two to be more exact after the bullish breakout is

Will Orchid (OXT) rally to broken market structure?On the above 5 day chart price action has corrected almost 70% since the year began. A number of reasons now suggest a reversal in trend, they include:
1. Price action and RSI resistance breakouts.
2. A significant confirmation that legacy downtrend breakout now acts as support.
3. Price action con

Long OXTGood moment to try to Buy OXTUSDT. We have ready temporary low point that can be a first point in the forming new up trend. Also before we can see 3 fast move down and back days. It can be good signals that instrument to take a power for future move up. Now the good moment to take it with good risk

UpdateThe only good thing about this chart is that for now price is holding onto EMA 150 support. If price loses this support and breaks below the daily EMA 150 it means you have to accept that this project is still in a bear market. For us to confirm that there’s a bull market ahead of us, price needs to

HUGE opportunity for $OXTThe breaking of the triangle is imminent, matter of hours/days if the trend continue in this way.
Otherwise there will be one last push back before the next ATH, don't sleep on this one.

See all ideas
Summarizing what the indicators are suggesting.
Oscillators
Neutral
SellBuy
Strong sellStrong buy
Strong sellSellNeutralBuyStrong buy
Oscillators
Neutral
SellBuy
Strong sellStrong buy
Strong sellSellNeutralBuyStrong buy
Summary
Neutral
SellBuy
Strong sellStrong buy
Strong sellSellNeutralBuyStrong buy
Summary
Neutral
SellBuy
Strong sellStrong buy
Strong sellSellNeutralBuyStrong buy
Summary
Neutral
SellBuy
Strong sellStrong buy
Strong sellSellNeutralBuyStrong buy
Moving Averages
Neutral
SellBuy
Strong sellStrong buy
Strong sellSellNeutralBuyStrong buy
Moving Averages
Neutral
SellBuy
Strong sellStrong buy
Strong sellSellNeutralBuyStrong buy
Displays a symbol's price movements over previous years to identify recurring trends.